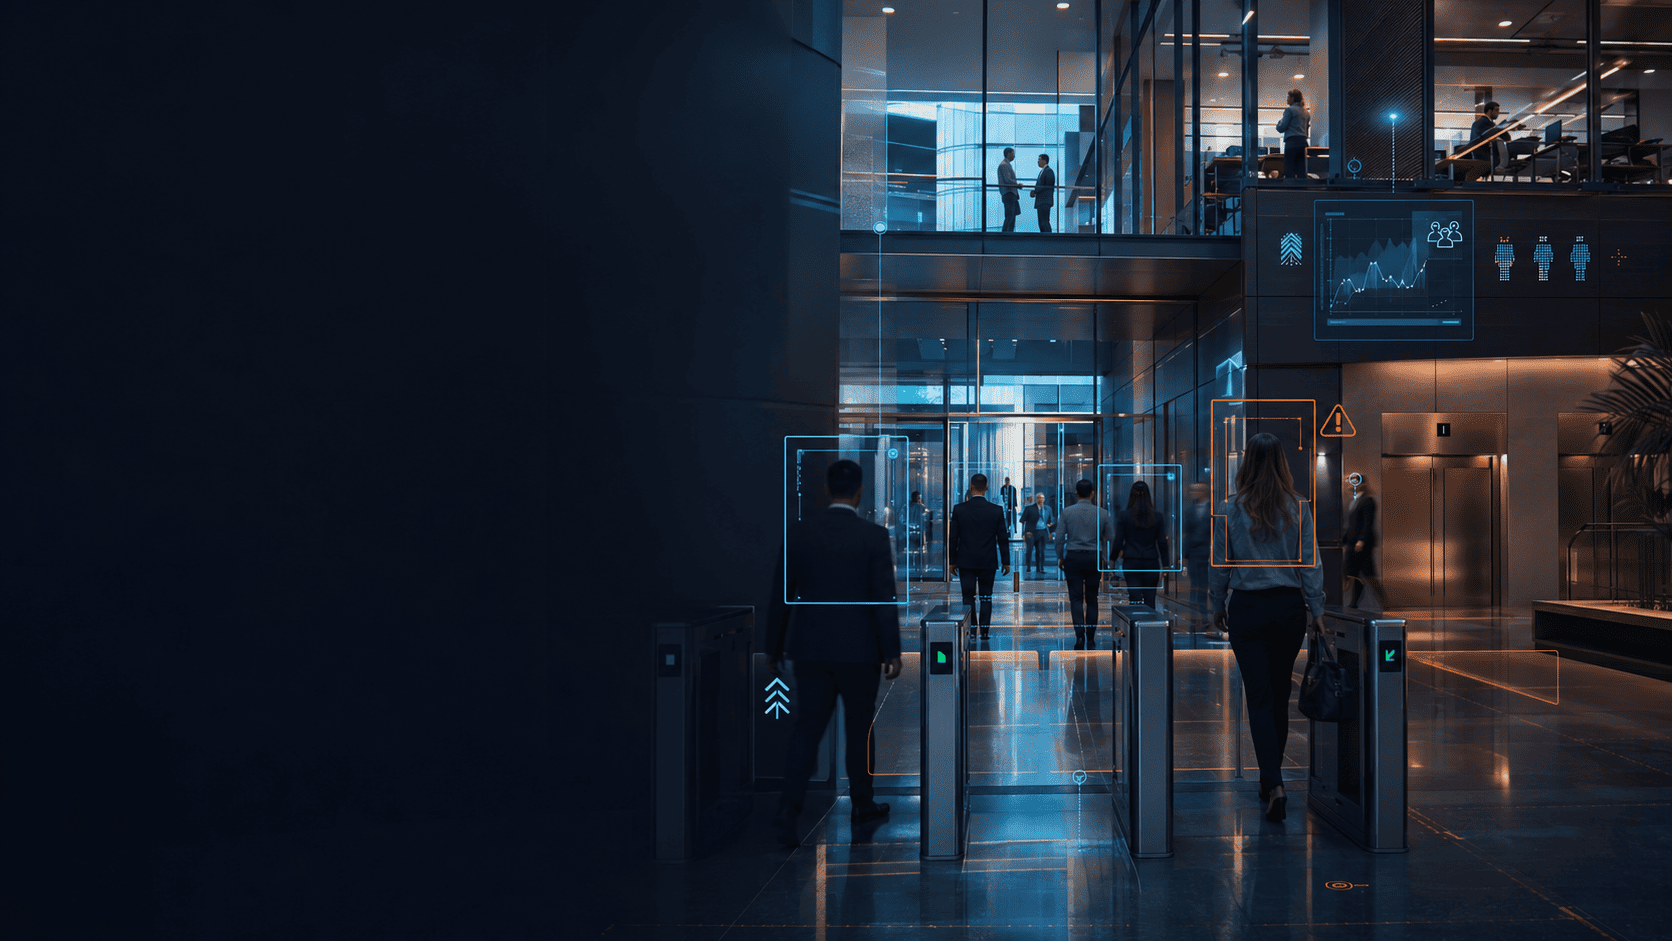
Statanly for business centers

Video analytics for business centers and offices

A unified layer for controlling entrances, office zones, workplaces, meeting rooms, safety, fire and smoke using existing cameras and integrations with access and office systems.

24/7events, frames and evidence without manual archive review
peopleemployee and visitor counting, load at entrances, elevators, floors and common areas
accessarrival at work, entrances, turnstiles, passes and rule-based presence
officeworkplaces, meeting rooms, shared zones and absence from station
RTSPconnection to existing IP cameras, VMS, NVR and edge infrastructure
HSEfire, smoke, falls, conflicts, unattended objects and hazardous zones
Challenge

An office building needs to be visible as a managed operation

Business centers usually already have cameras, turnstiles and access passes. Without analytics, they do not provide a unified view of building load, employee presence, zone usage and operational safety.

No factual view of building load

How many people entered and where elevators, floors and common areas are overloaded is often visible only through impressions or tenant complaints.

Arrival and absence are hard to verify

A pass shows an entry fact, but not always whether an employee is in the required zone, workplace or shift station.

Zones are used unevenly

Meeting rooms may be booked and empty, lounge areas overloaded, while some workplaces remain unused.

Incidents require fast response

Fire, smoke, fall, conflict, unattended object or blocked exit should become notifications, not remain only in the archive.

Core AI modules

Modules for a business center, office and site network

Scenarios can be launched step by step: counting and entrances first, then workplaces, meeting rooms, safety, fire and smoke, followed by a unified control center for a building network.
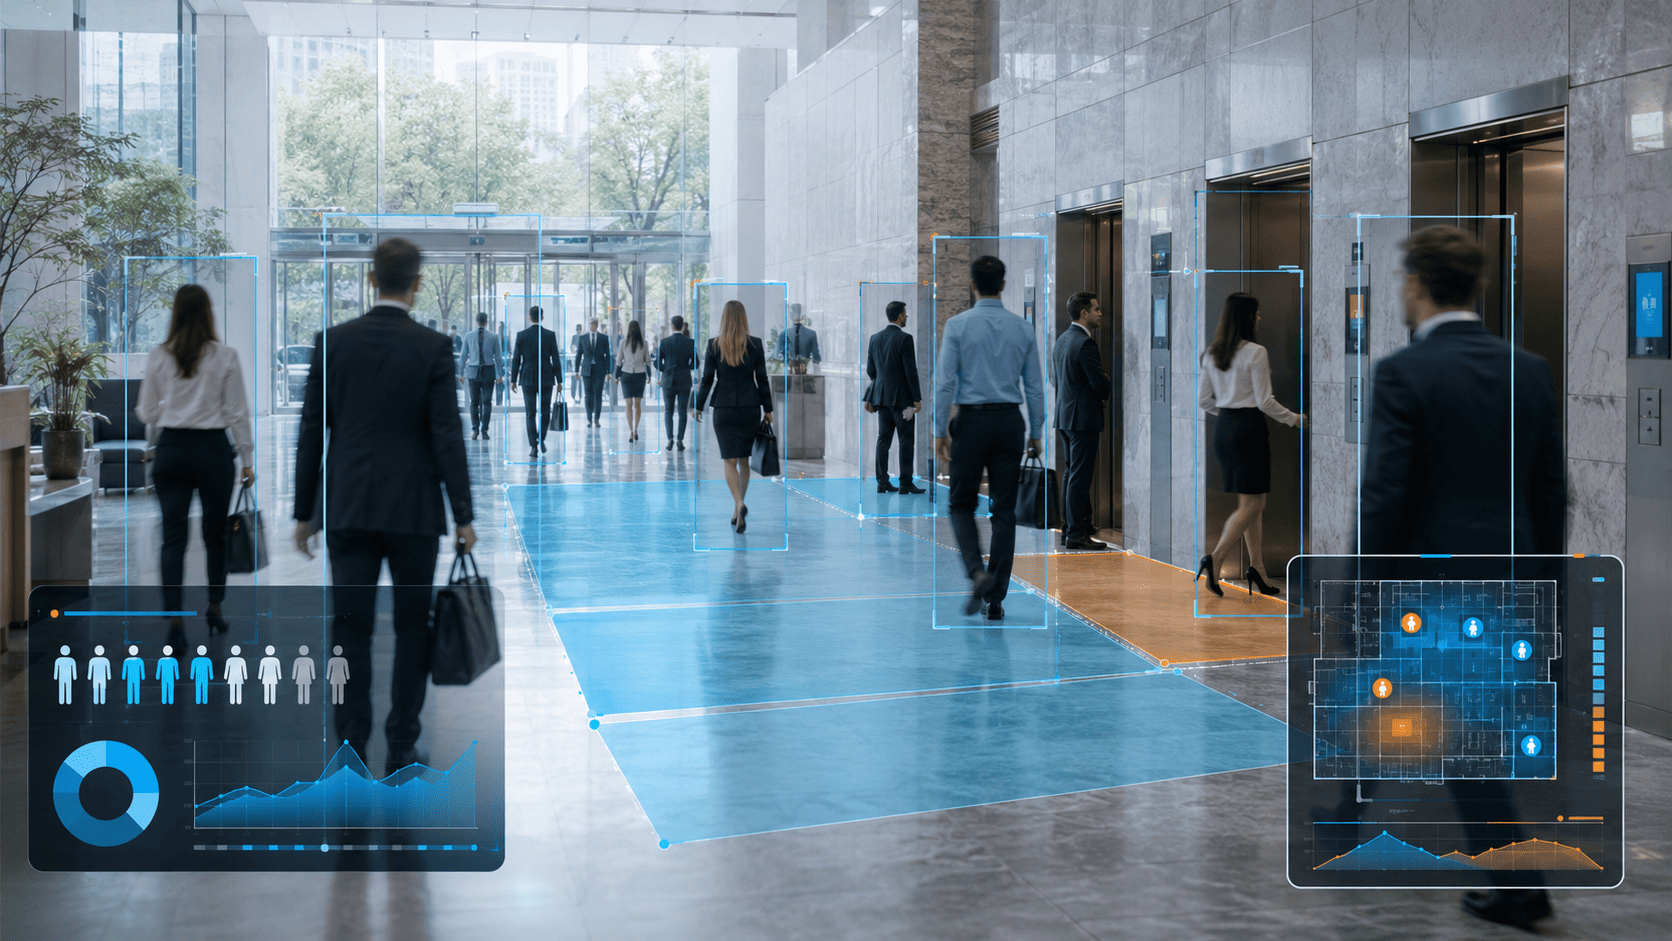
People counting and zone occupancy in a business centerPeople

Counting and zone occupancy

Entrances, elevators, floors, halls, shared zones, peak hours and actual attendance.
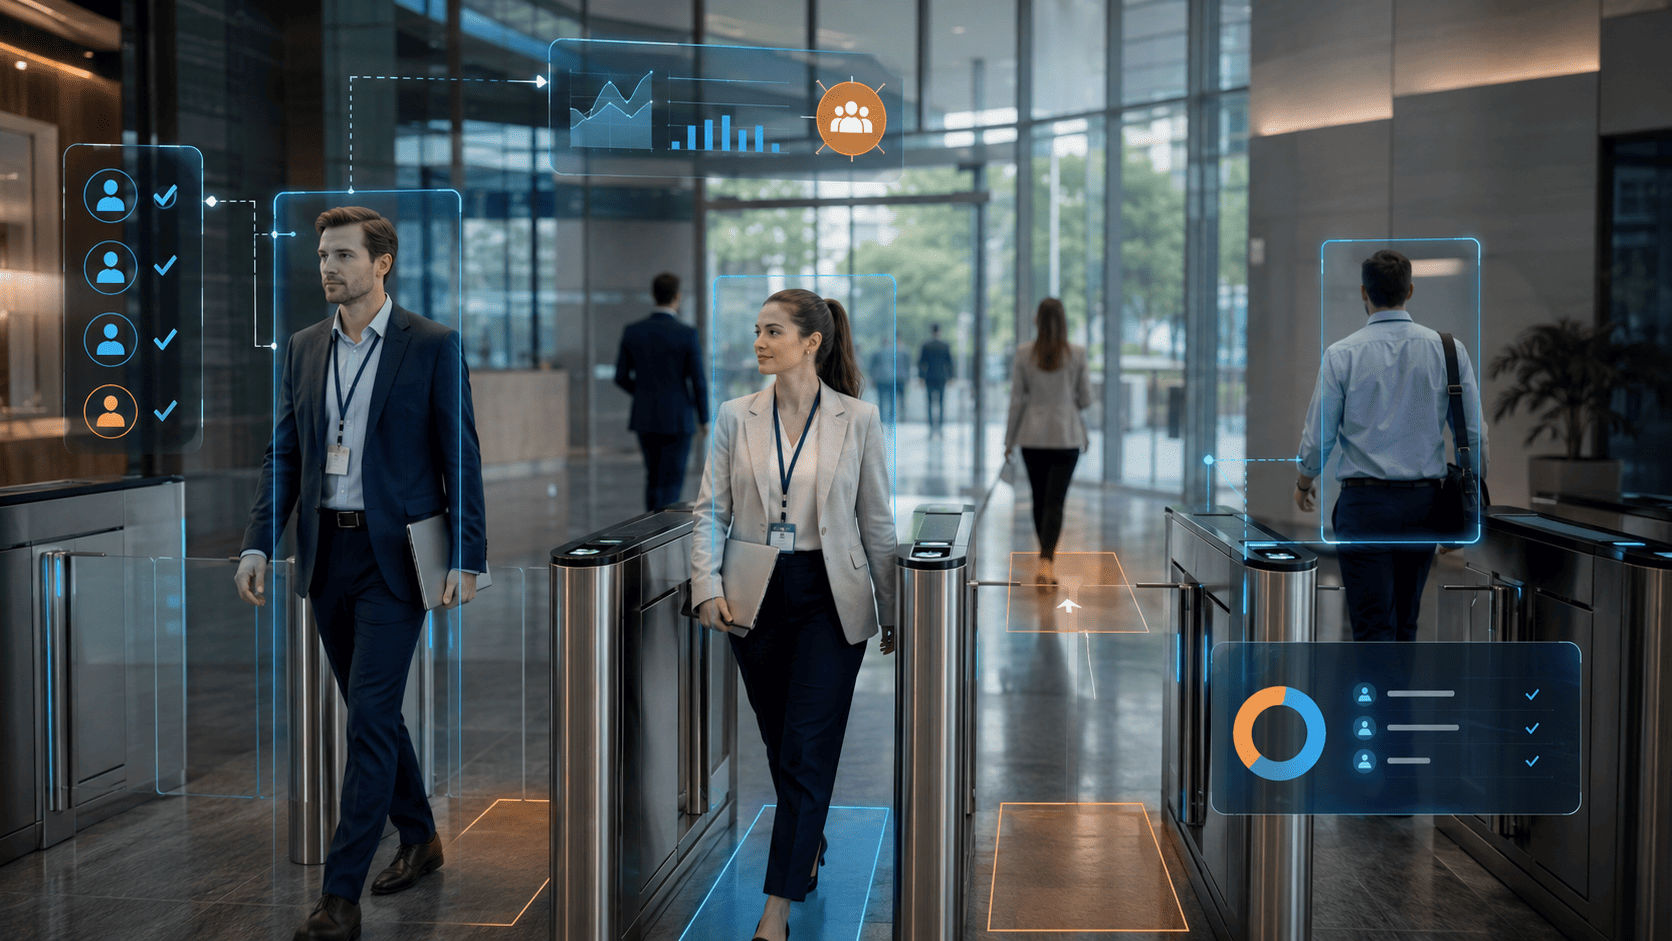
Employee arrival through business center turnstilesAccess

Arrival at work

Entrances, turnstiles, passes, shift start, late arrival and linkage to regulations.
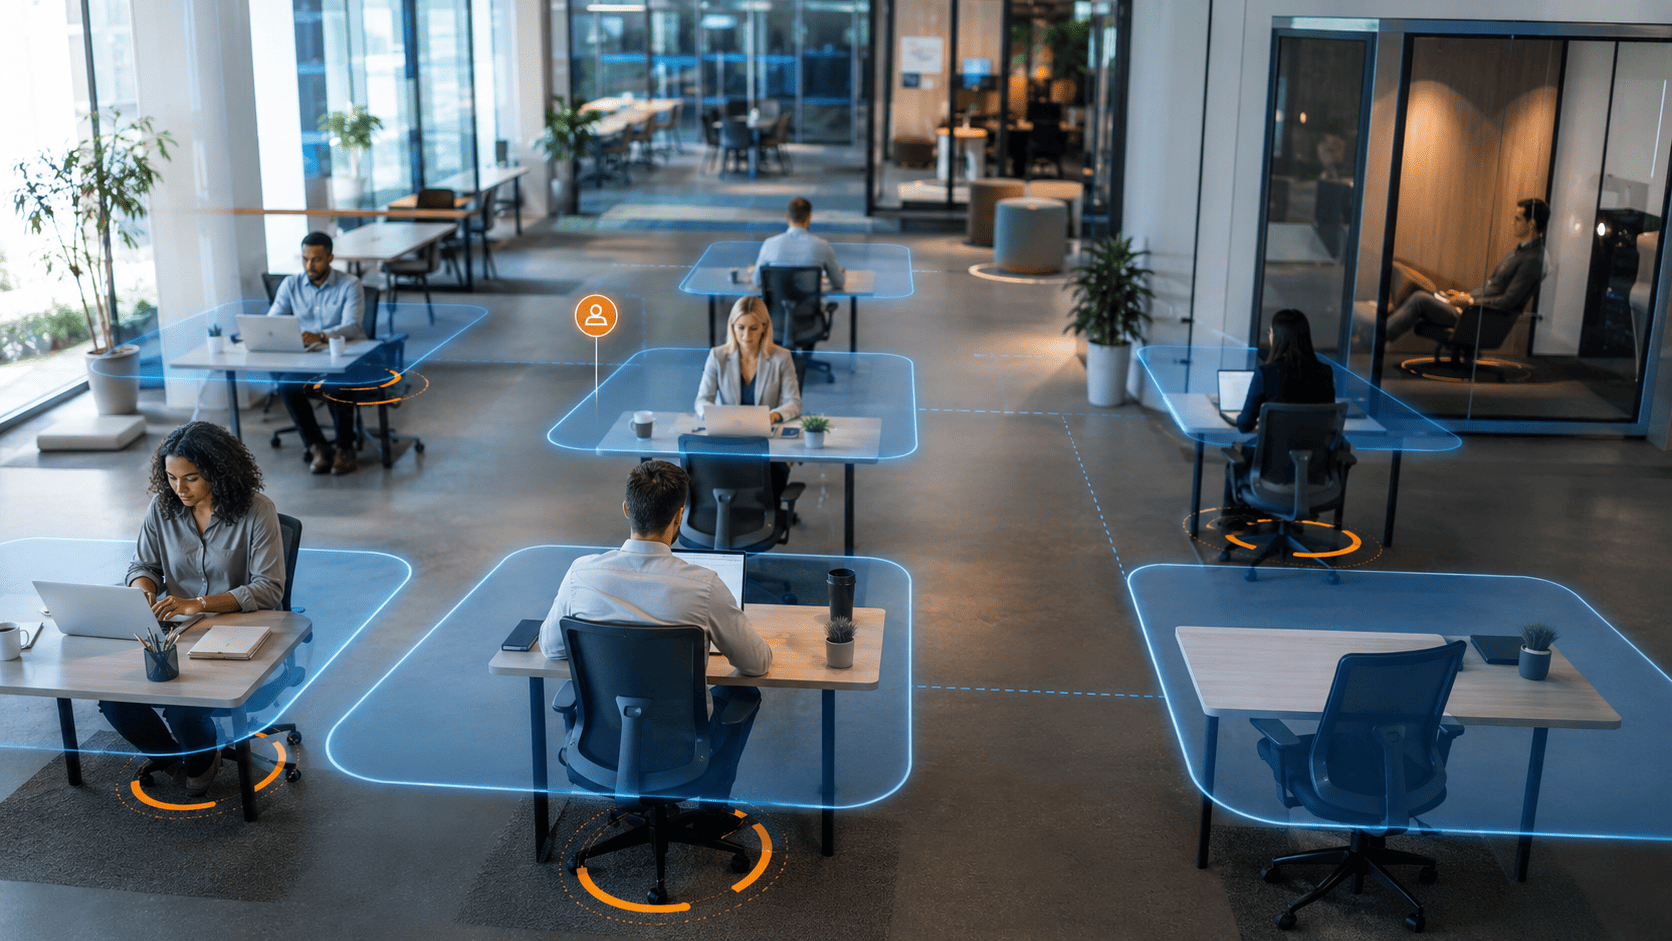
Employee presence and absence at workplacesWorkplaces

Presence and absence

Work zones, stations, absence from workplace, long idle periods and shift schedule compliance.
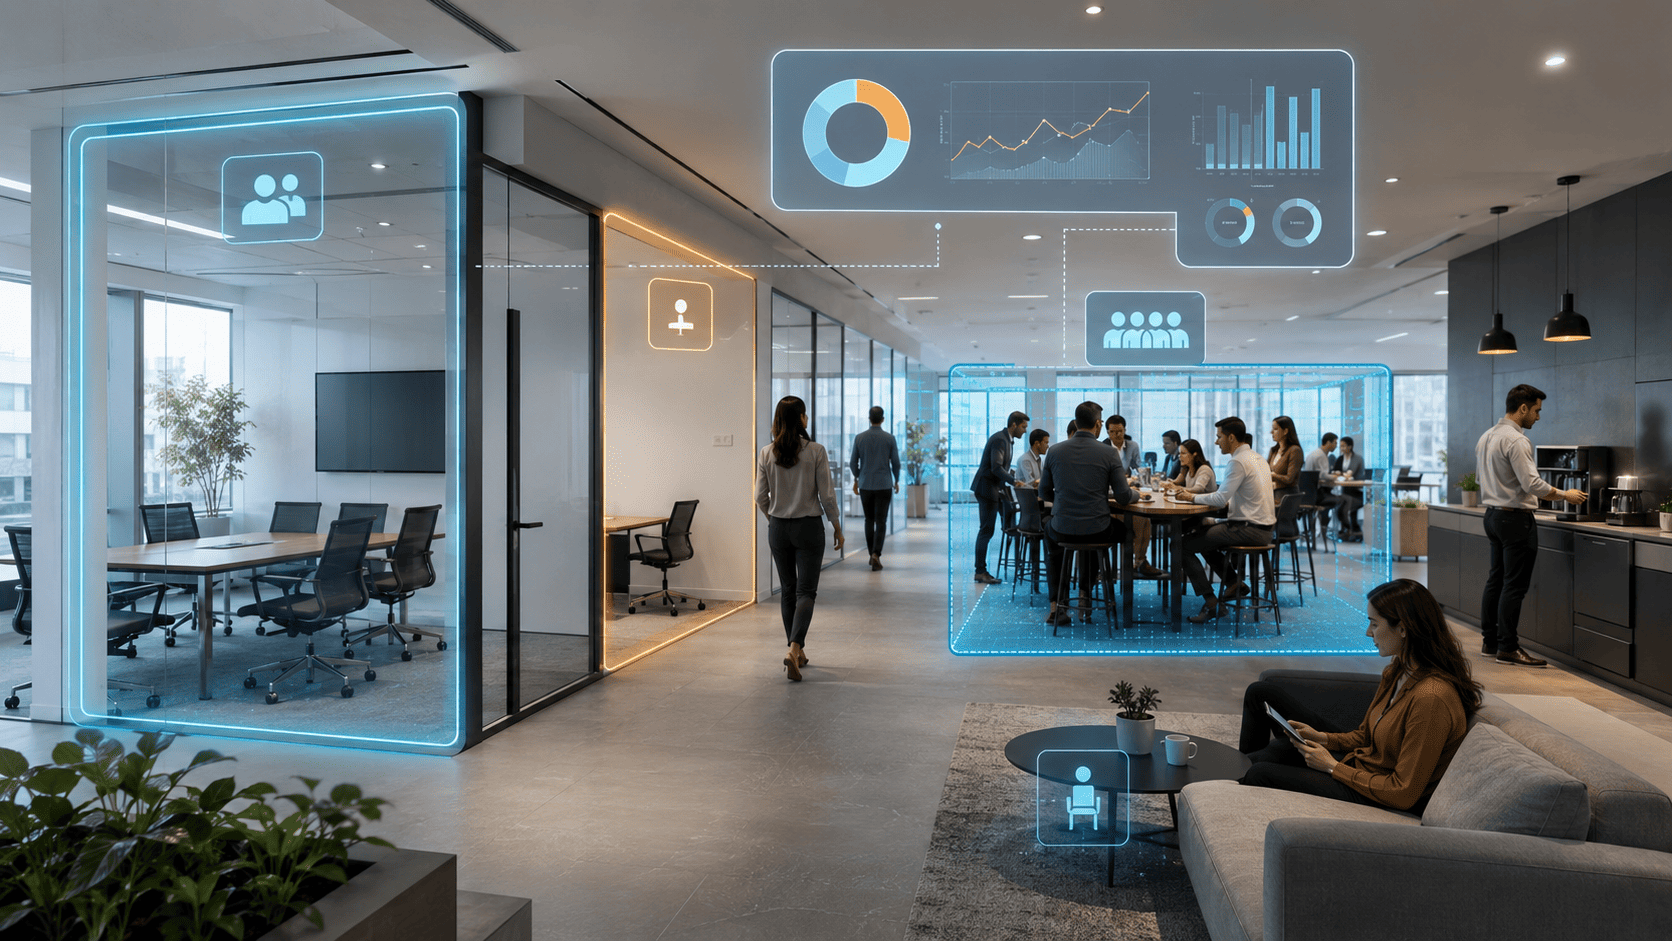
Analytics for meeting rooms and shared office zonesRooms

Meeting and shared zones

Actual room occupancy, empty bookings, overloaded lounge areas and office space usage.
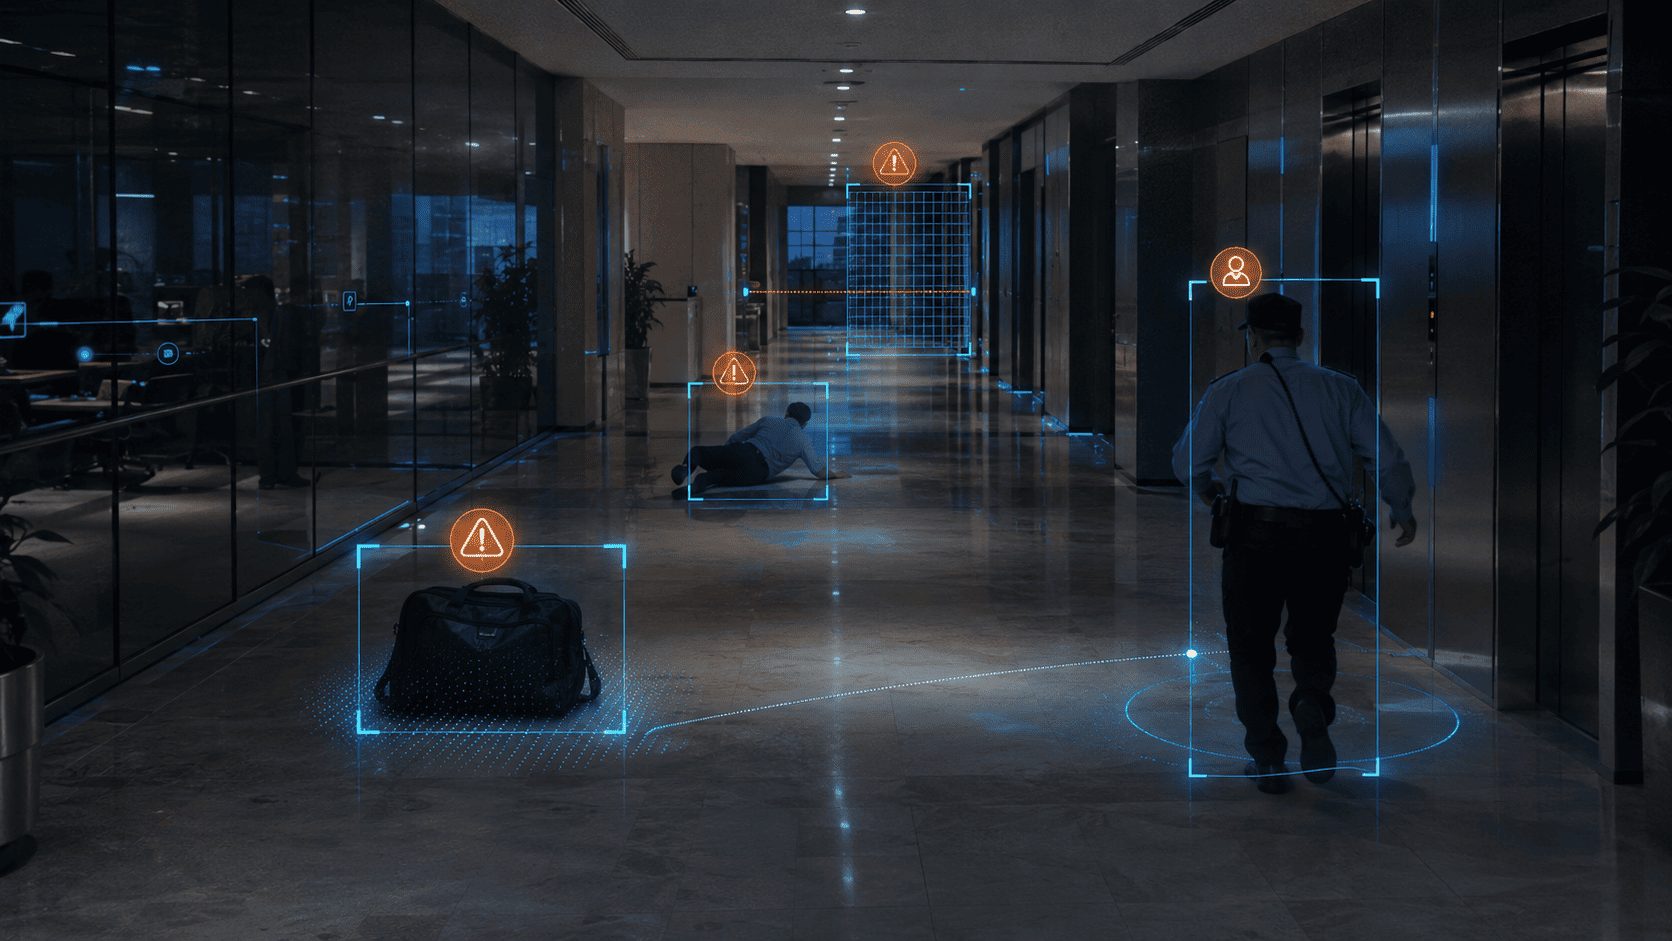
Safety and incidents in a business centerSafety

Safety and incidents

Falls, conflicts, unattended objects, unauthorized presence in service zones and blocked exits.
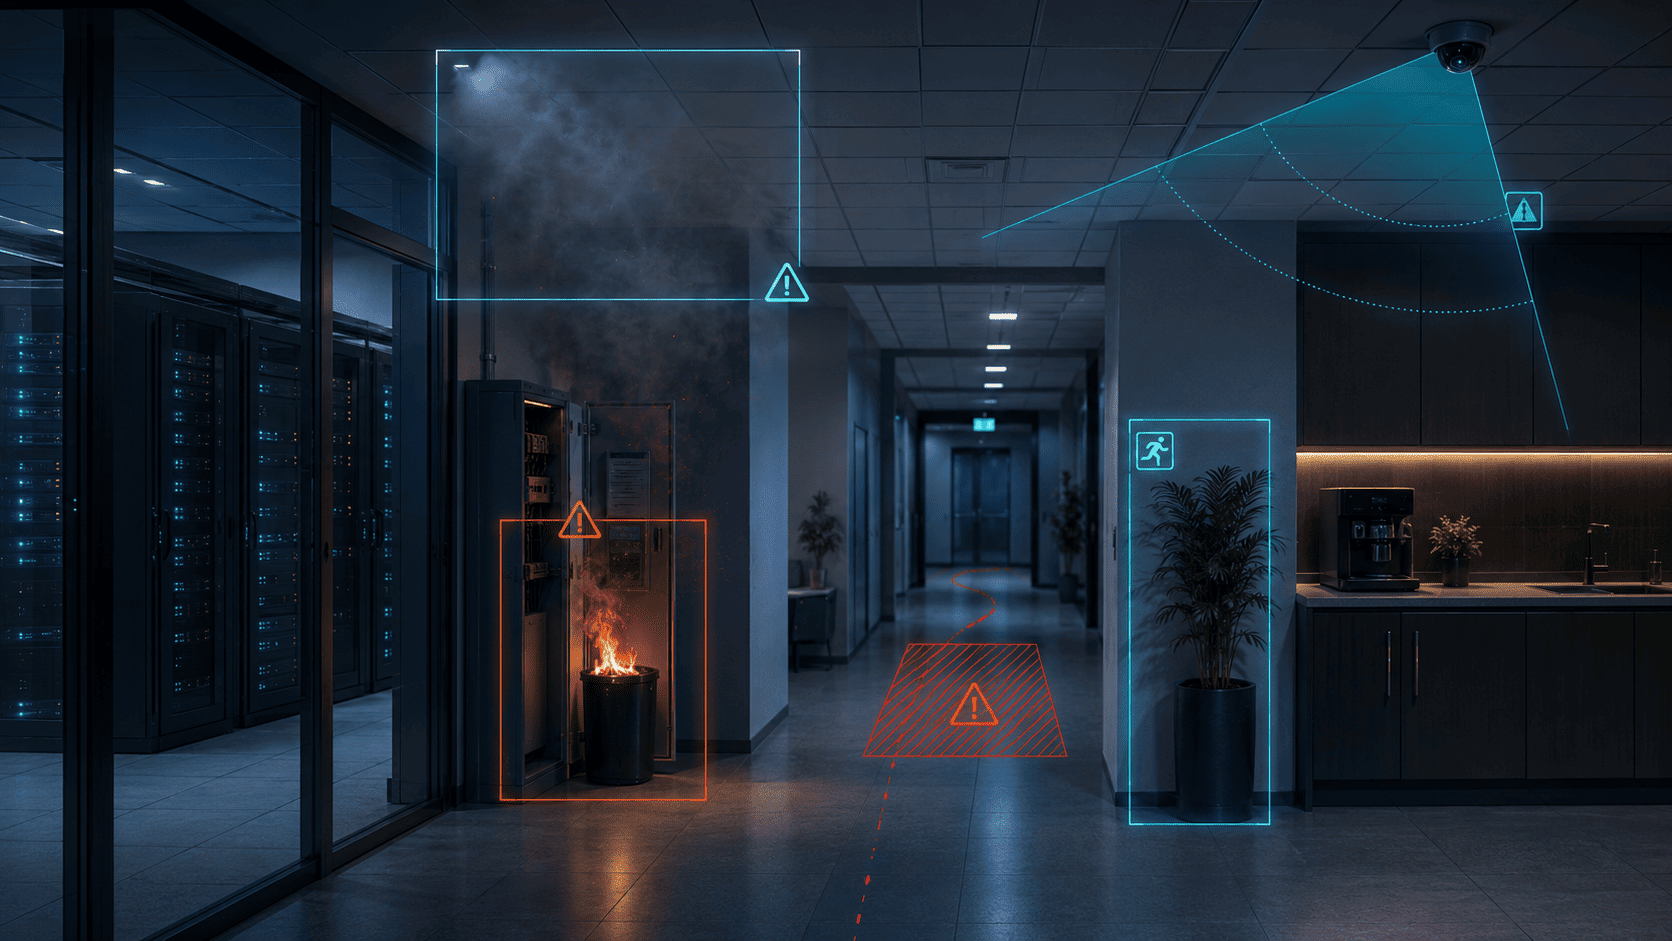
Fire and smoke detection in an office buildingFire / smoke

Fire, smoke and evacuation

Early signs of smoke, open flame, overheating, blocked exits and hazardous zones.
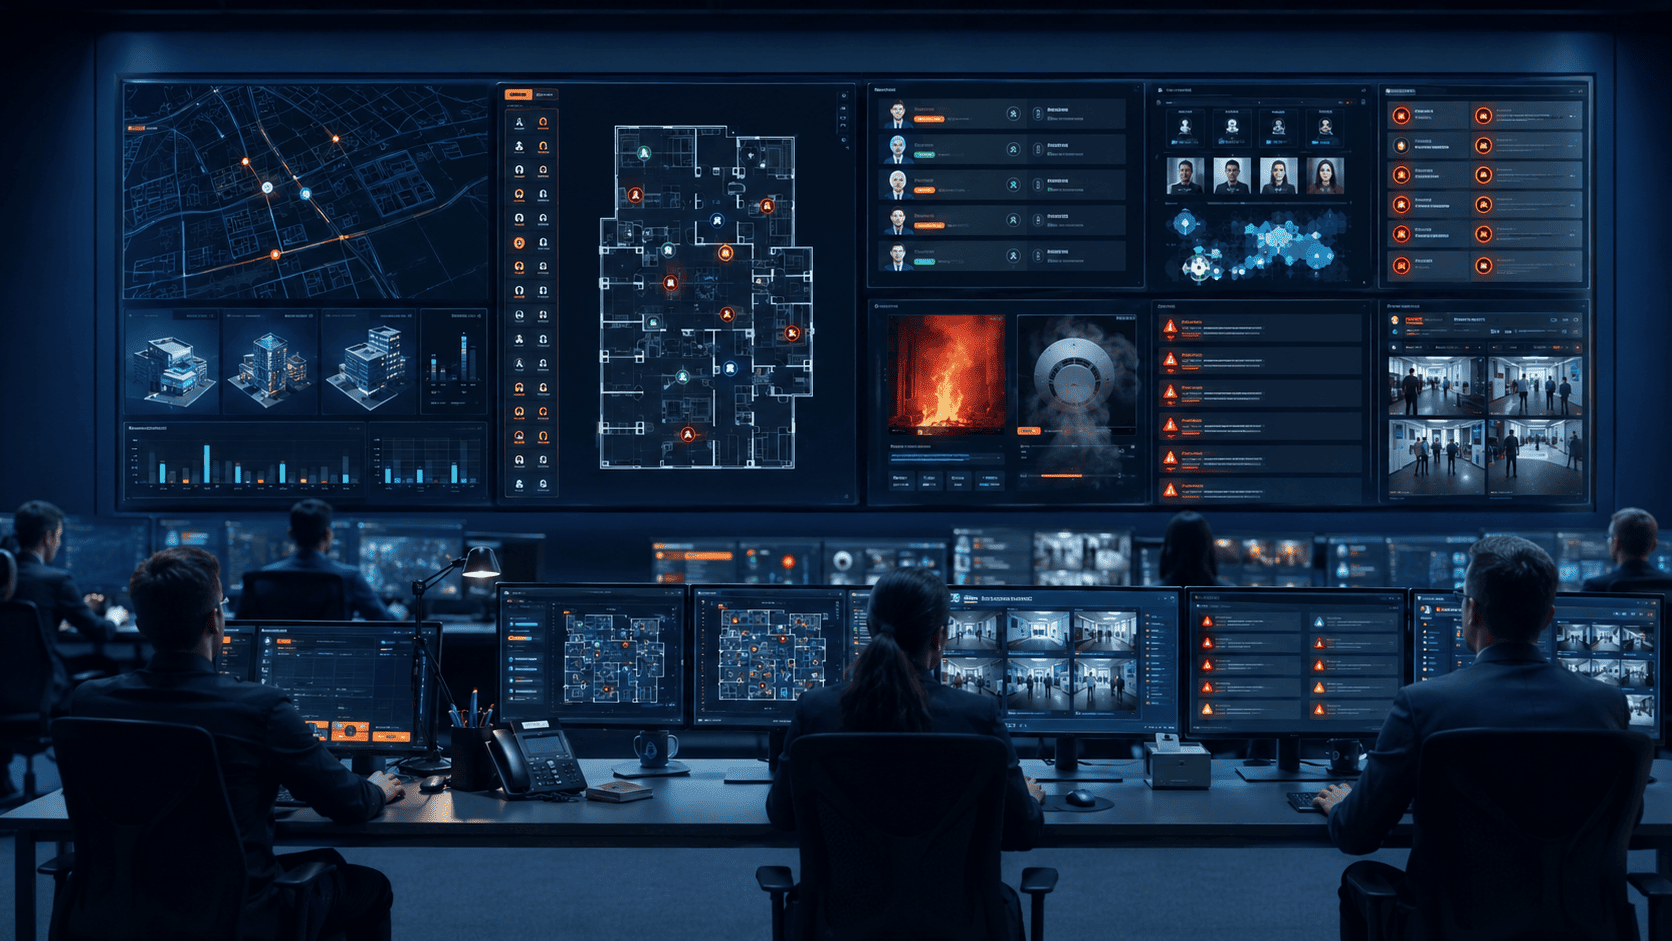
Business center network control centerCenter

Unified control window

Building map, office zones, entrances, events, safety, archive, KPIs and site comparison.

How it works

From camera feed to event, zone status and operator action

The platform analyzes video streams, links events to building zones and sends statuses to administrators, security, facility teams or office systems.

People counting and zone occupancy in a business center
Cameras show actual dynamics at entrances, elevators, floors, halls and shared zones.
Counting and occupancy

Building, floor, elevator and shared-zone load

Video analytics counts employees and visitors, shows peak hours, overloaded zones and areas where people stay longer than usual.

This is useful for operations, cleaning, security, elevator management and tenant communication.

  • incoming and outgoing flow counting
  • occupancy of floors, elevators, halls and shared zones
  • peak hours and recurring overloads
  • history by days, weeks, tenants and zones
counting occupancy KPI
Employee arrival through business center turnstiles
The system records passage through entrance zones and helps compare actual presence with work regulations.
Arrival and access

Arrival at work, passages and rule-based presence

The scenario can be built without mandatory biometrics: using zones, passes, access rules and approved integrations.

For disputed cases, frames, time, zone and event type remain available.

  • arrival at work and shift start
  • late entry or no passage
  • comparison with access control according to project rules
  • presence check in the required zone
access presence rules
Employee presence and absence at workplaces
For office teams, entrances are not enough: actual presence in the required zone matters, whether it is a desk, reception desk, service area or administrator station.
Workplaces

Presence, absence and work zones

Video analytics records long absence, an empty station, overloaded zone or unusual activity.

Rules are configured for the specific regulation and privacy level.

  • absence from workplace or station
  • work zone occupancy without personal identification
  • long stay outside the required zone
  • statistics by zones, shifts and tenants
workplaces absence shifts
Analytics for meeting rooms and shared office zones
Meeting rooms are often booked in advance but not actually used, while other zones are overloaded.
Meeting rooms

Meeting rooms, lounges and office spaces

The system shows real room occupancy, usage duration, empty bookings and overloaded shared areas.

This helps adjust booking rules, cleaning, layout and space allocation.

  • actual meeting room occupancy
  • empty booking and overtime use
  • overloaded lounges, kitchens and shared spaces
  • office space utilization analytics
rooms booking layout
Safety and incidents in a business center
A business center includes visitors, tenants, employees, delivery staff and contractors. Events around people, objects and restricted zones matter.
Safety

Incidents, unattended objects and service zones

The platform helps notice a fall, conflict, unattended object, unauthorized person in a service zone or blocked exit faster.

Notifications are sent to responsible teams together with frame, zone and time.

  • fall, conflict or unusual behavior
  • unattended item, bag or box
  • unauthorized presence in service and technical zones
  • blocked passages, doors and evacuation routes
incidents security archive
Fire and smoke detection in an office building
An office building includes server rooms, kitchens, electrical panels, parking and tenant areas. Early visual signs of smoke and fire matter.
Fire and smoke

Fire risks, smoke and evacuation routes

Video analytics complements fire automation with visual confirmation, exact zone and nearest camera.

It can also monitor free evacuation paths and blocked exits.

  • smoke, open flame and haze detection
  • control of server rooms, kitchens, electrical rooms and technical zones
  • event linked to floor, zone and nearest camera
  • notifications for security, operations and dispatch
smoke fire evacuation
Business center network control center
When several sites are involved, comparable statuses matter: load, entrances, presence, meeting rooms, incidents, fire risks and recurring problems.
Control center

A unified digital layer for one building or a site network

The dashboard combines building map, cameras, events, archive, notifications, reports and site comparison by KPI.

Roles are separated: management company, security, facility operations, tenant administrators and head office.

  • building, floor, zone and status map
  • event log with frames and time
  • site comparison by load, discipline and safety
  • data export to BI and internal systems
network KPI BI
Impact

What we measure in the pilot

Metrics depend on layout, cameras, access control and tenant regulations. In the pilot we capture baseline values, launch 3–5 scenarios and compare results using the same metrics.

+occupancytransparent view of entrances, floors, elevators, shared zones and office spaces
+presencearrival, absence from station and actual presence in the required zone according to rules
+eventsincidents, unattended objects, fire, smoke and evidence frames in the log
2–4 weekstypical pilot on one building, floor or camera group
For whom

One control layer for management, tenants, security and facility operations

Each team sees its own events: management sees building KPIs, tenants see office regulations, security sees incidents, and facility teams see zones and safety.

Facility operations

  • load of entrances, elevators, floors and shared zones
  • meeting rooms, cleaning, service zones and requests
  • fire, smoke, evacuation paths and technical zones

Office / tenants

  • arrival at work and rule-based presence
  • absence from workplace or shift station
  • usage of meeting rooms and office zones

Security

  • falls, conflicts and suspicious behavior
  • unattended objects and unauthorized service-zone presence
  • fast jump to camera, frame and archive

Head office

  • comparison of buildings, floors and tenants
  • KPIs, SLAs, reports and network dynamics
  • shared event and notification rules
Integrations

Connects to existing building infrastructure

No need to replace video surveillance. Scenarios run on top of existing cameras and can gradually connect to access control, office calendars, BI, VMS and notification channels.

IP cameras and VMS

RTSP/ONVIF, NVR/VMS, edge or server processing, work with already installed cameras.

Access control and passes

Events can be linked to turnstiles, passes, access zones and approved project rules.

Calendars and office systems

Meeting rooms, bookings, facility requests, BI dashboards and reports for the management company.

Notifications

Events for administrators, security, facility teams and tenants via interface, email, Telegram or webhook.

Related solutions

What is often connected with business center analytics

Business centers usually need parking, safety and a unified operations layer. These scenarios can be connected as separate blocks.

We will design a pilot for a business center, office or site network

We start with the camera plan, entrances, floors, tenants, office zones and regulations. Then we launch 3–5 scenarios, capture baseline metrics and keep only what produces measurable value.