
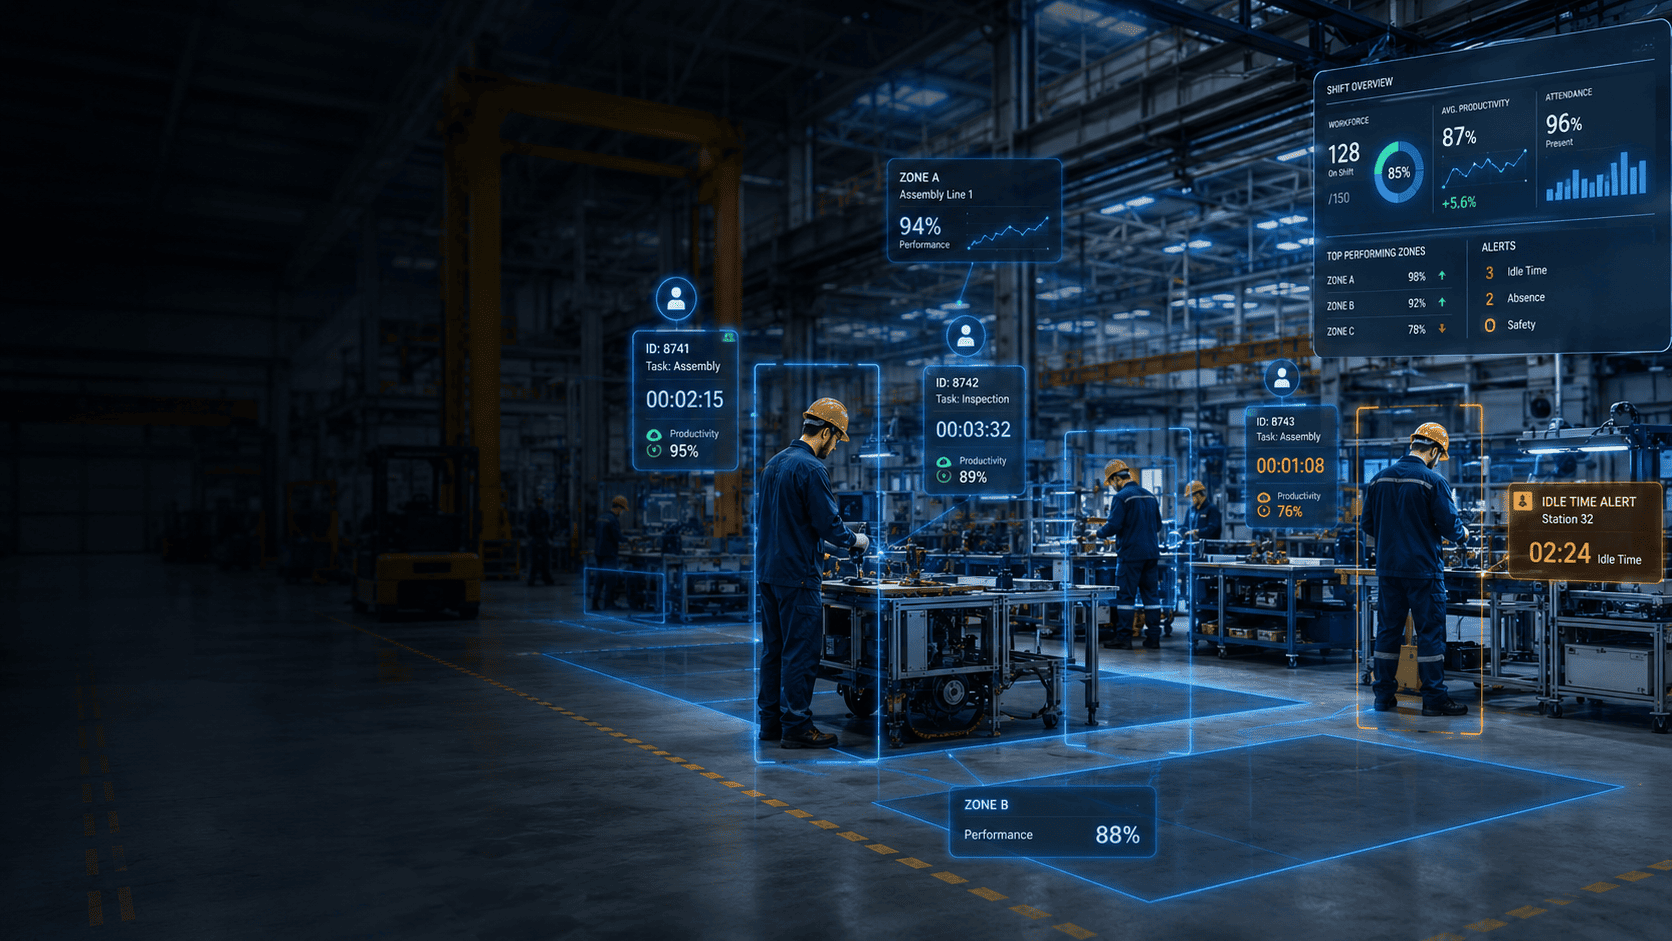
An AI platform for objective control of attendance, operation timing, idle time, routes, discipline, area workload and workforce KPI. The system consolidates events into a single analytics layer for production managers, security teams and operations leaders.
Managers usually see shift results after the fact, while real losses hide in small downtime, waiting, extra movement, rule violations and poor coordination between zones.
Downtime, waiting, distractions and inactivity accumulate quietly but directly affect output and deadlines.
Work assessment relies on walkarounds, spot checks and subjective shift reports.
Even good rules are followed differently across shifts, workshops, branches and contractors.
A line may stop because of missing people, materials, equipment, permission, checks or route errors.
Phones, smoking, excessive talks, crowding, leaving the workplace and bypassing restricted zones are detected too late.
Without an event archive it is hard to prove deviations, motivate staff fairly and improve processes.
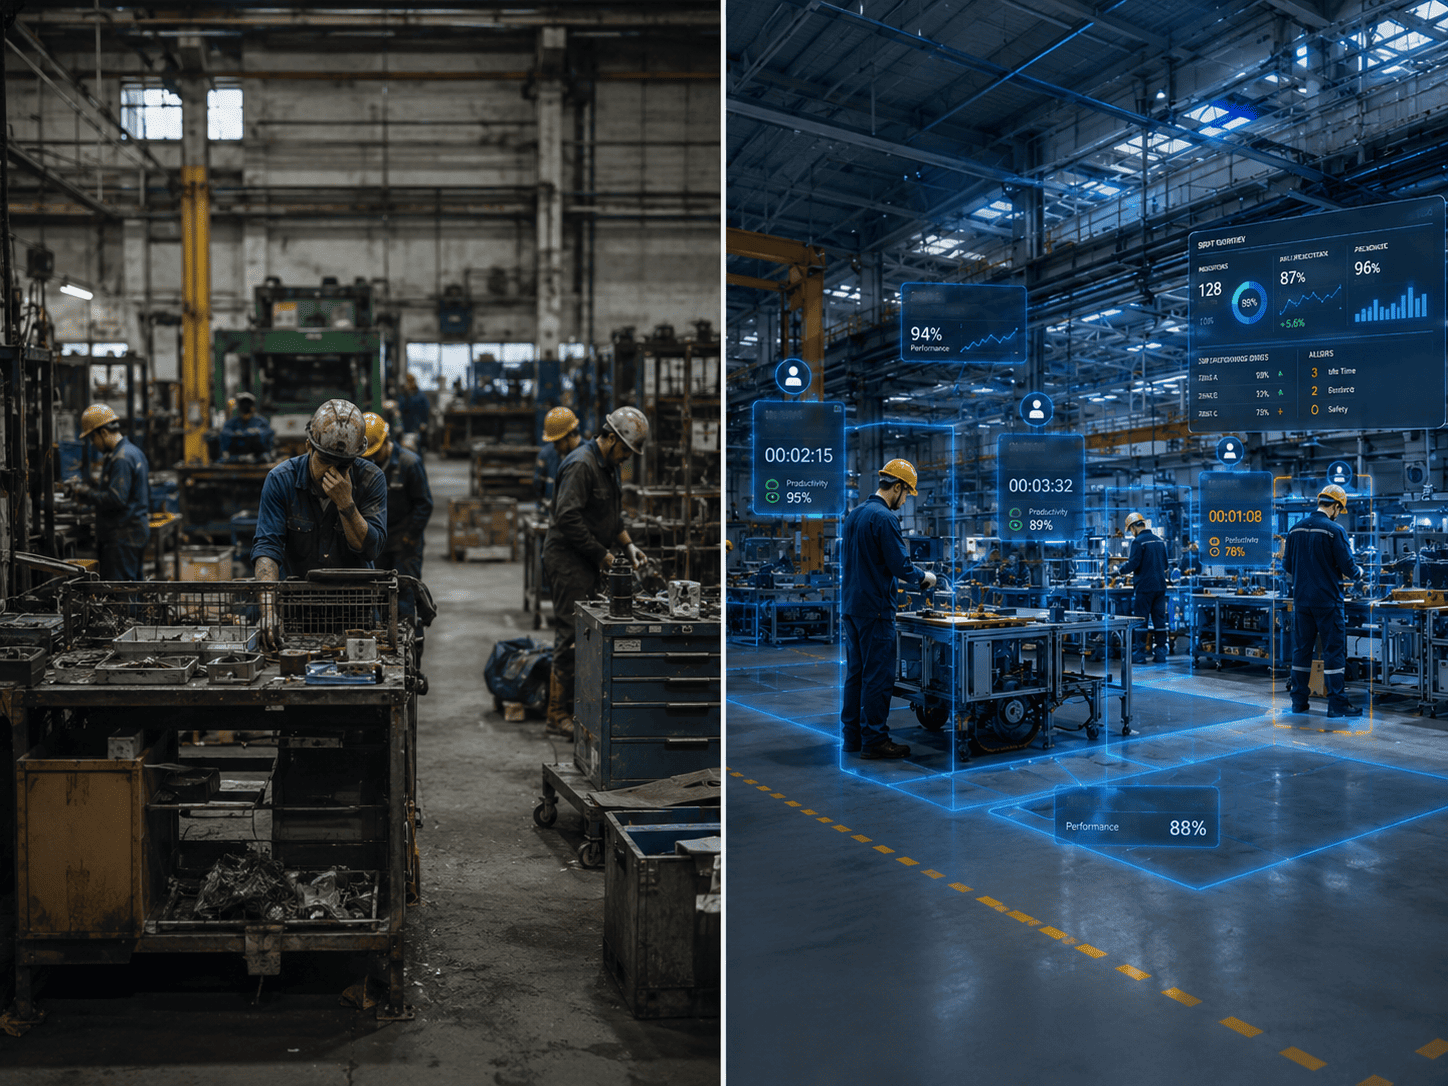
As in the industrial safety platform, the logic is “before / after”: less manual control, more events, metrics and clear actions.
The shift is analyzed after the fact; part of violations and downtime never reaches reports.
Managers cannot see where people, equipment or lines actually stay idle.
Reports take time, figures conflict and are not always supported by facts.
Cameras automatically capture events, timing and deviations across key zones.
Heatmaps, routes, zones, shifts and stations show actual workload of the site.
Metrics, events, frames and reports are available for management, QA, production and security.
Scenarios can be launched step by step: attendance and downtime first, then routes, discipline, production operations, safety and industry-specific cases.
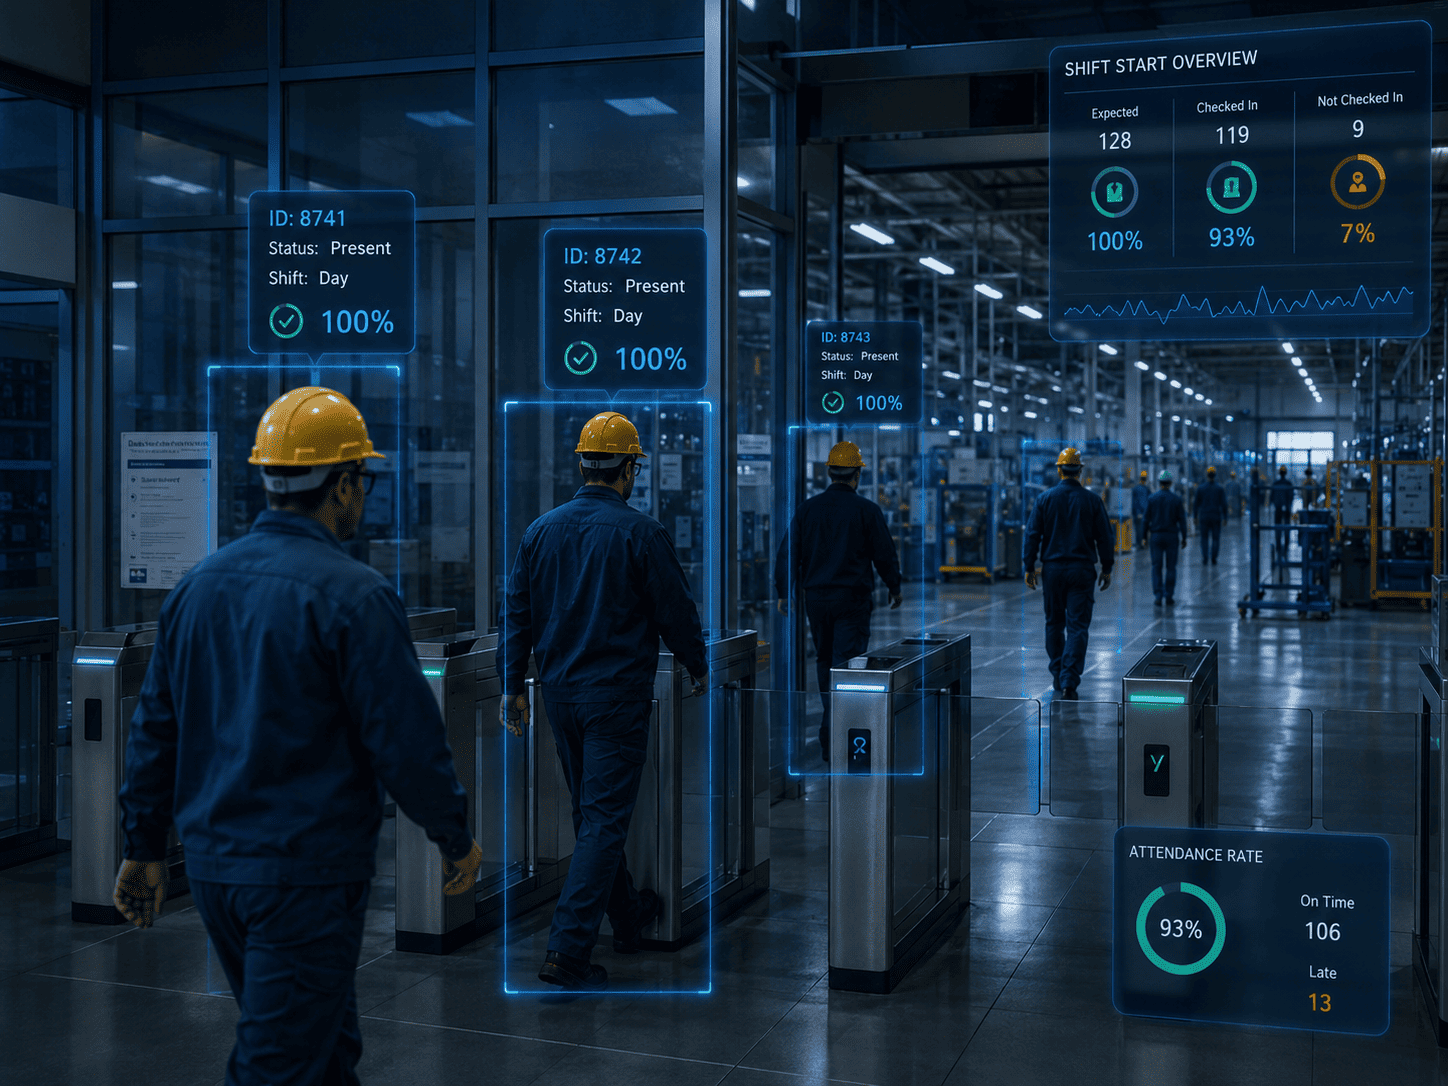
Check-in, check-out, absence, early leaving, lateness, presence in work zones and actual shift workload.
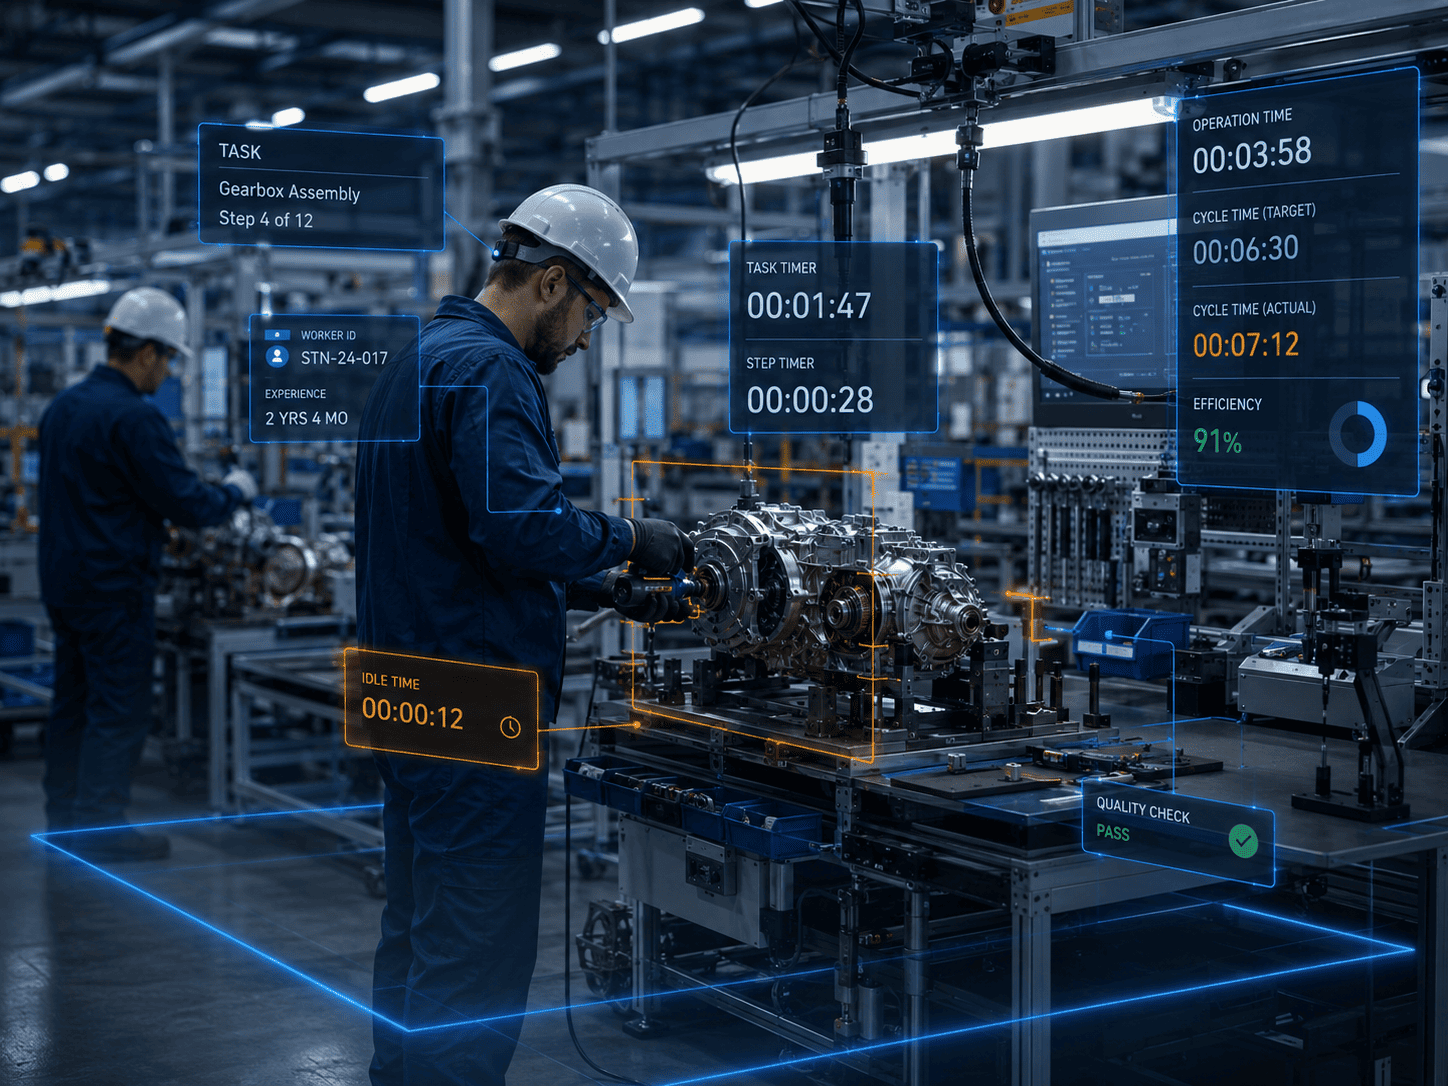
Measuring time of repeated operations, cycles, assembly stages, material waiting and deviations from standard time.
Detecting idle time, inactivity, waiting, downtime of teams, operators, equipment and production stations.
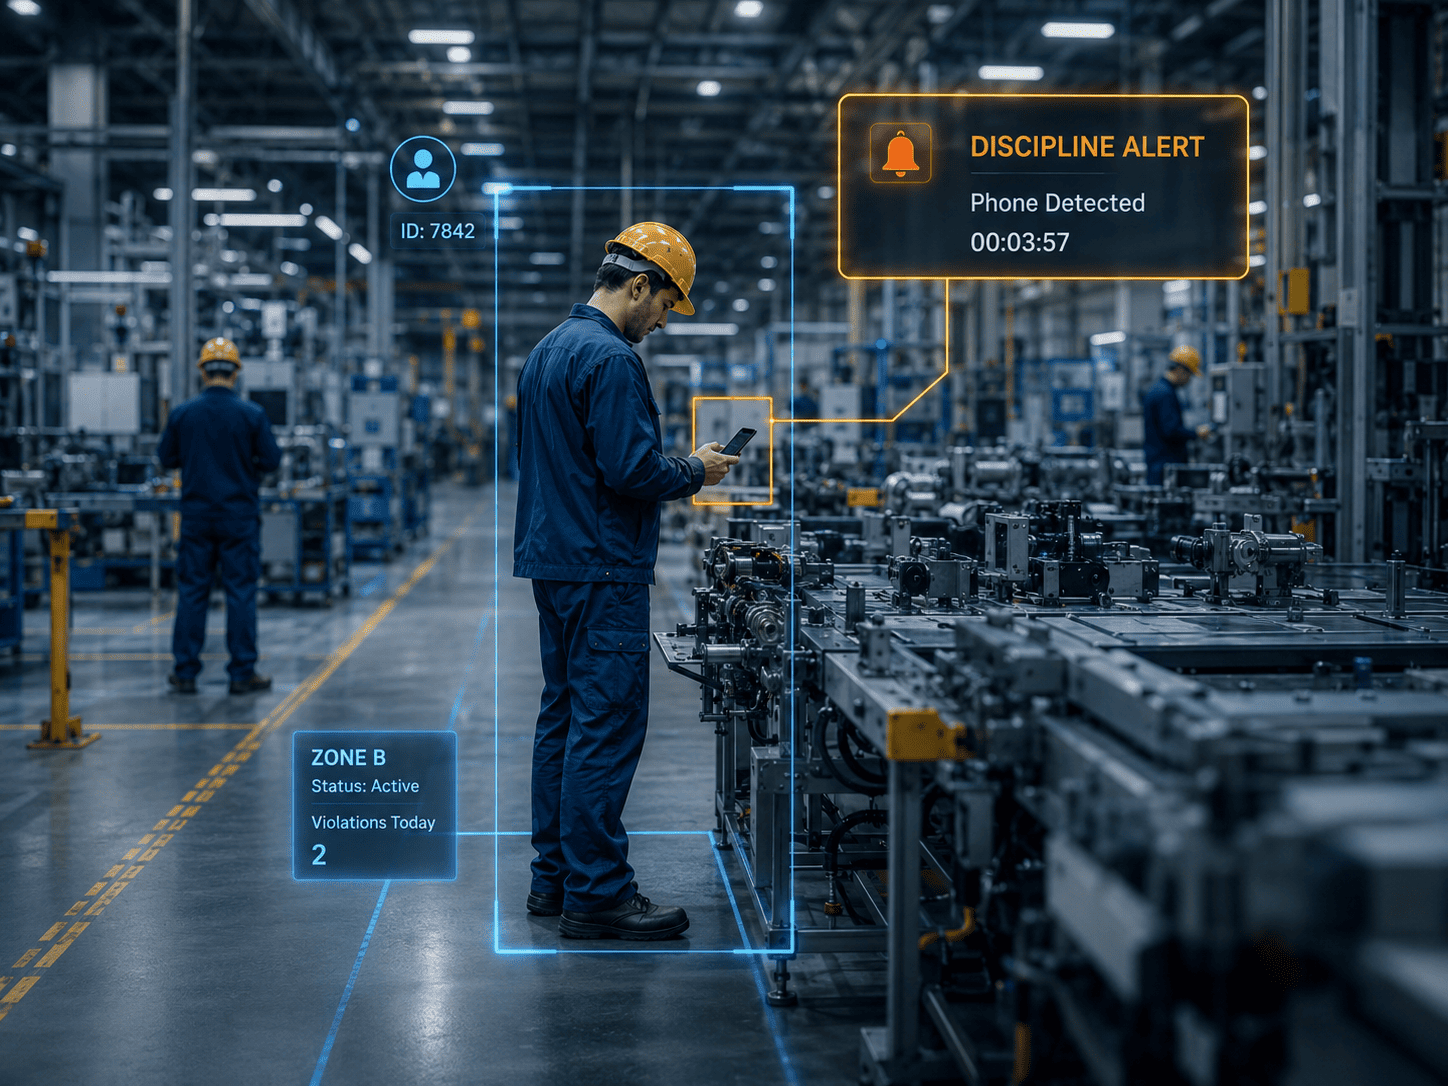
Detection of phone use, long conversations, distractions, smoking, procedure and discipline violations in work zones.
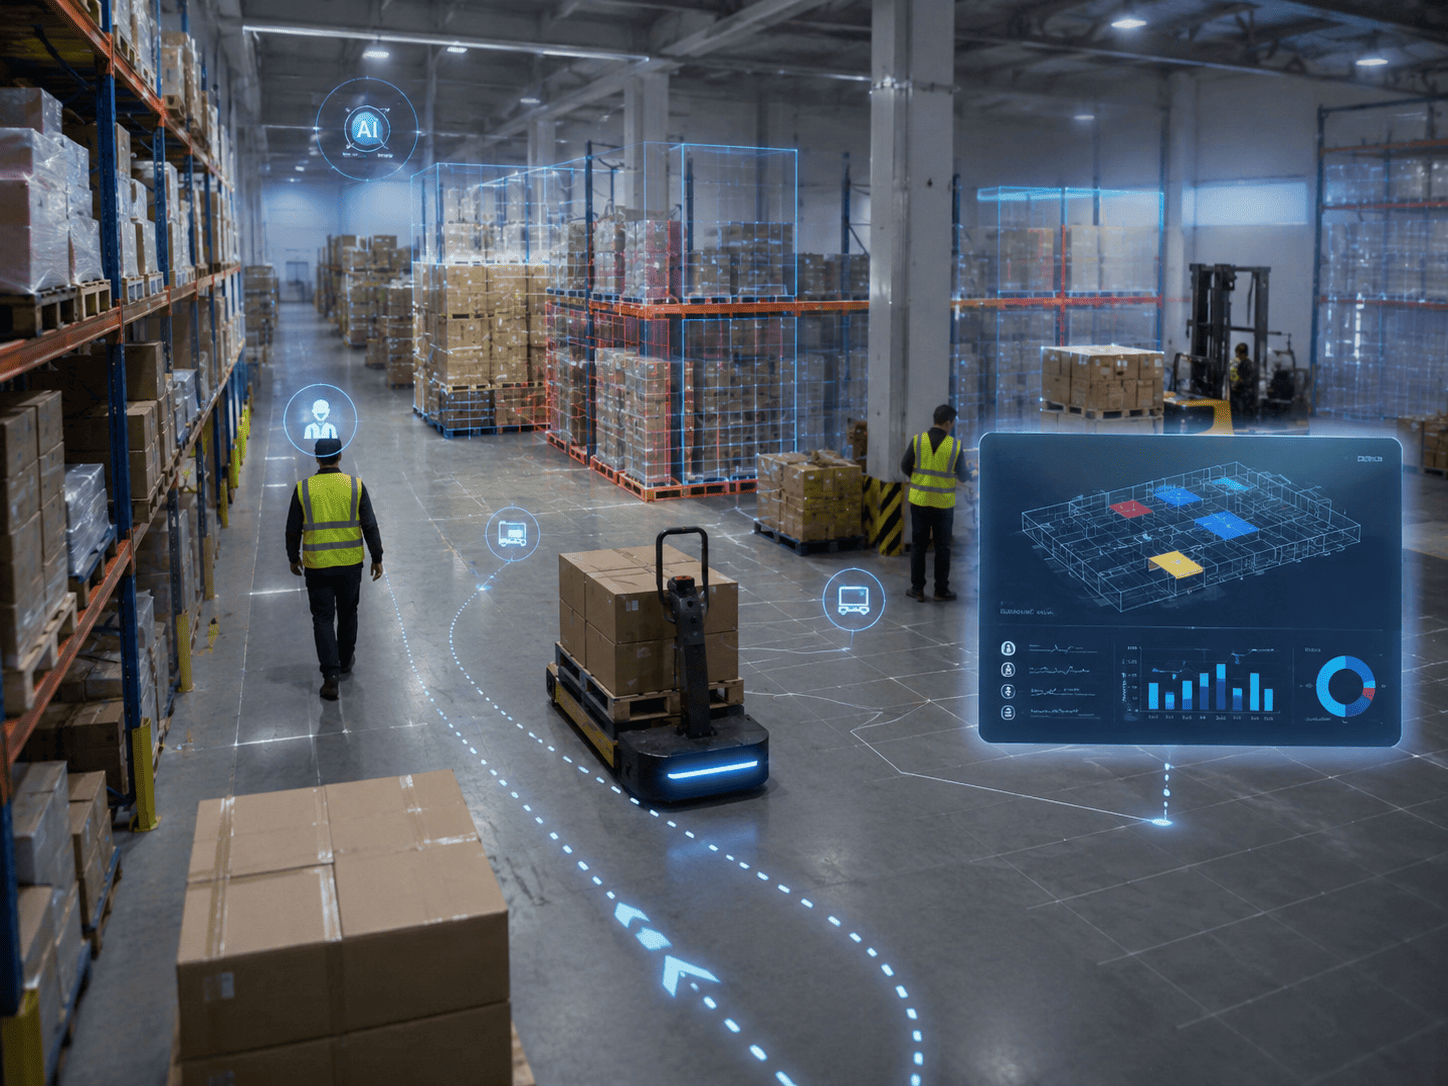
Multi-camera route reconstruction, rounds control, time in zones and inefficient movement patterns.
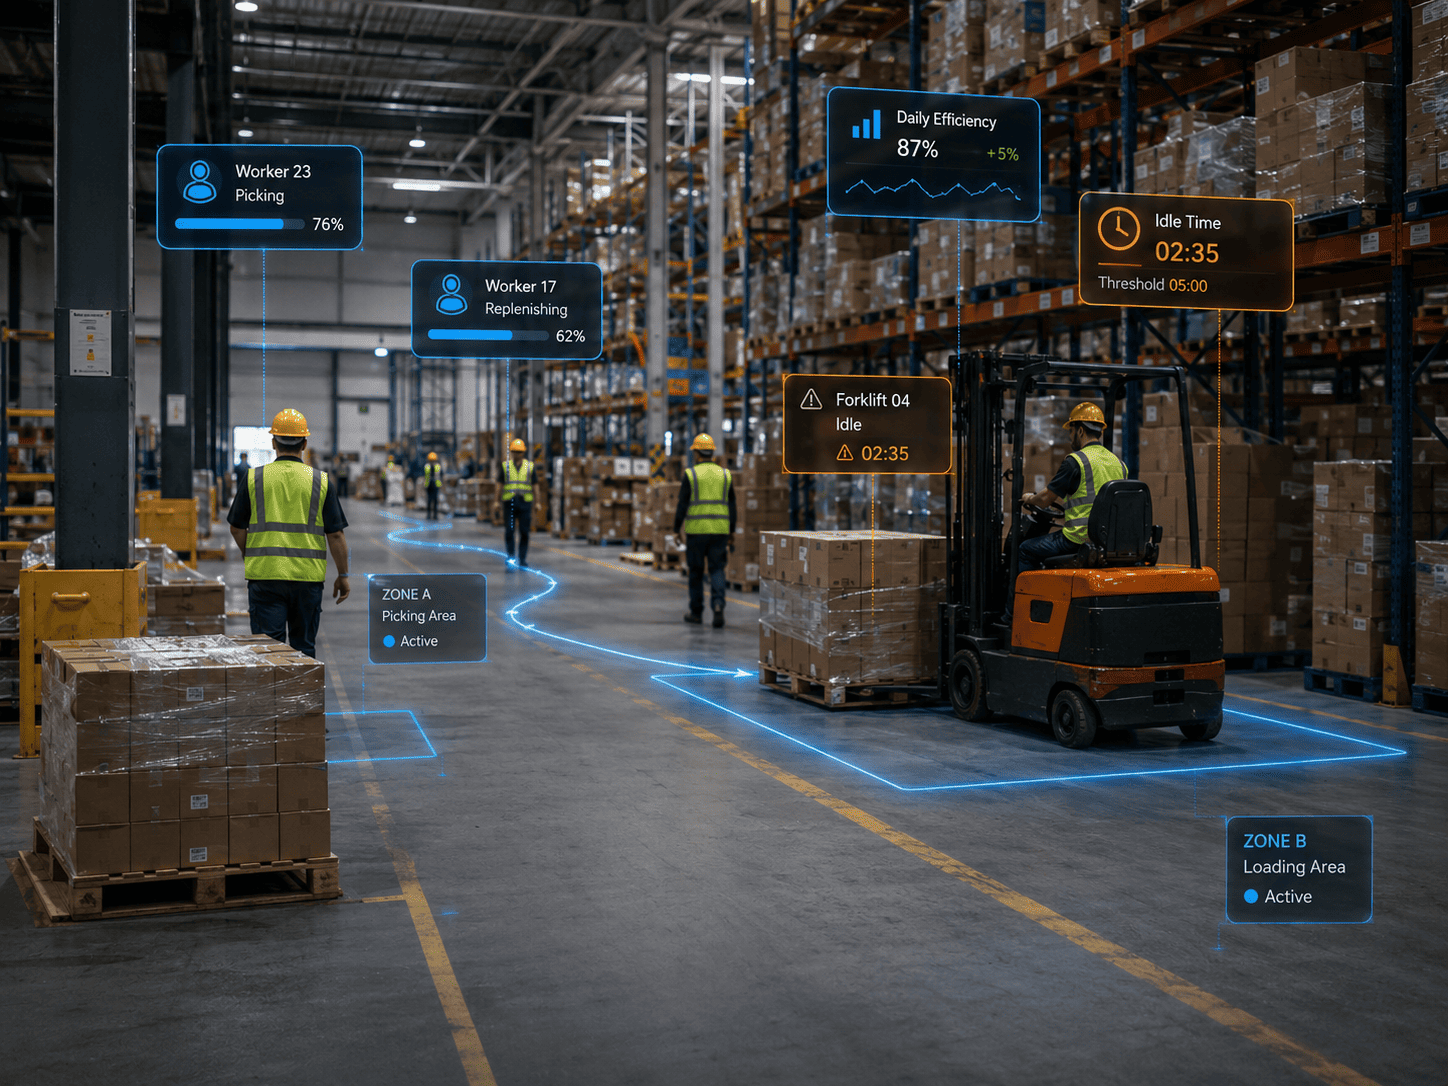
Detection of crowding, conflicts, queues, overloaded areas, bottlenecks and order violations.
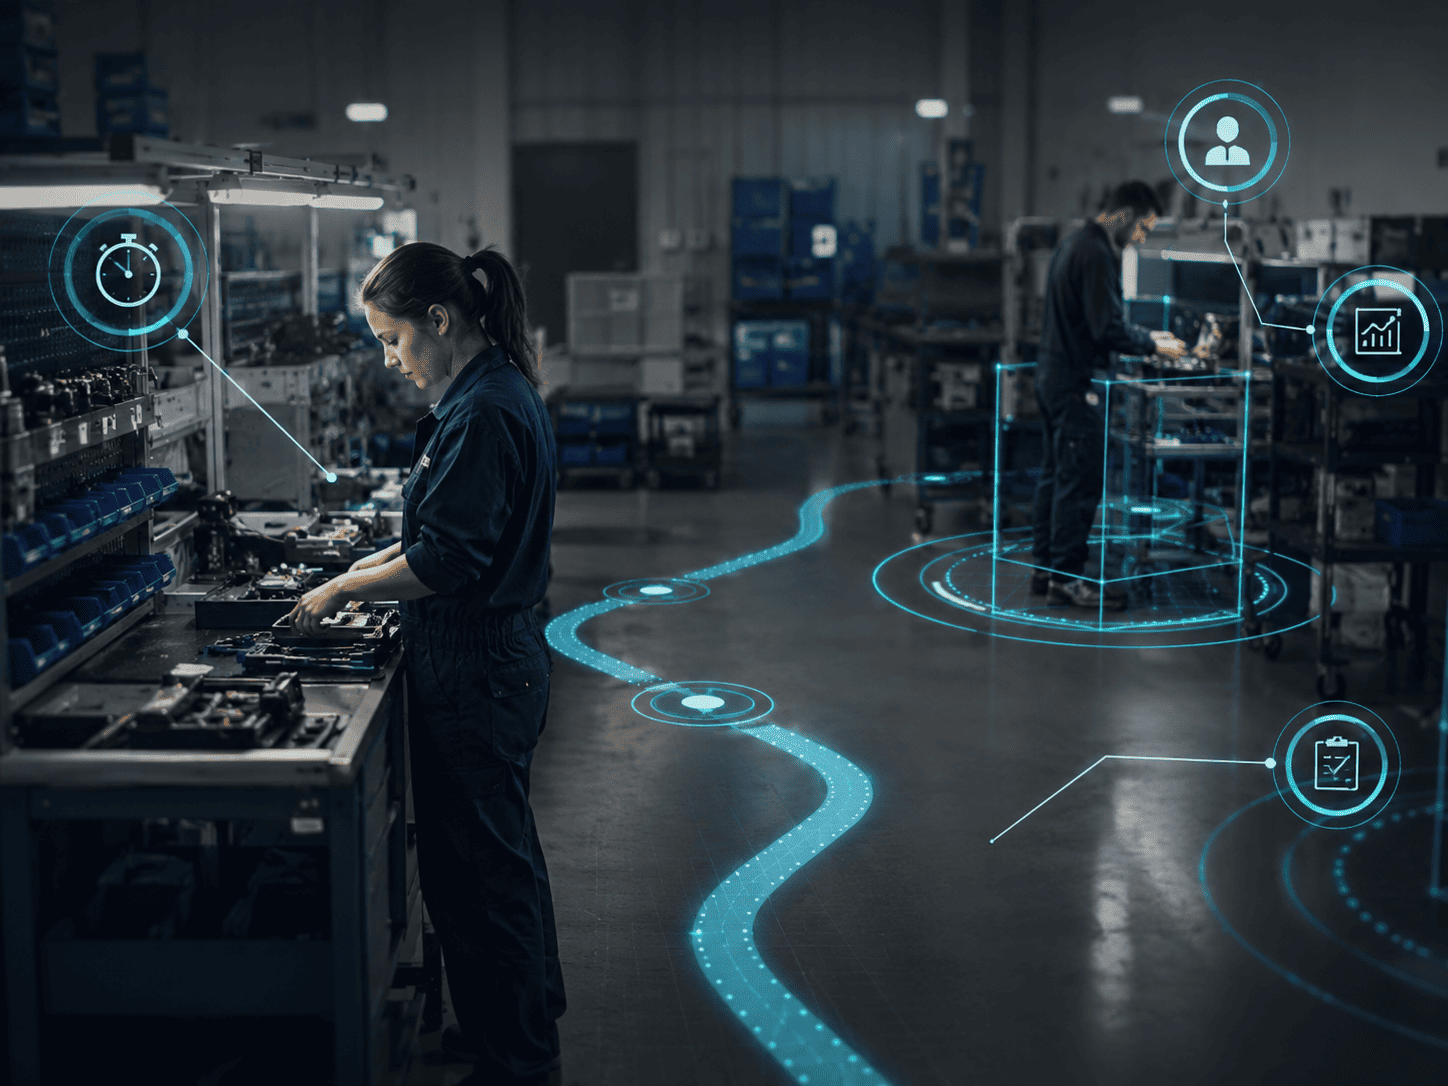
Control of actual presence, workload, routes, rule compliance and task duration for contractors.
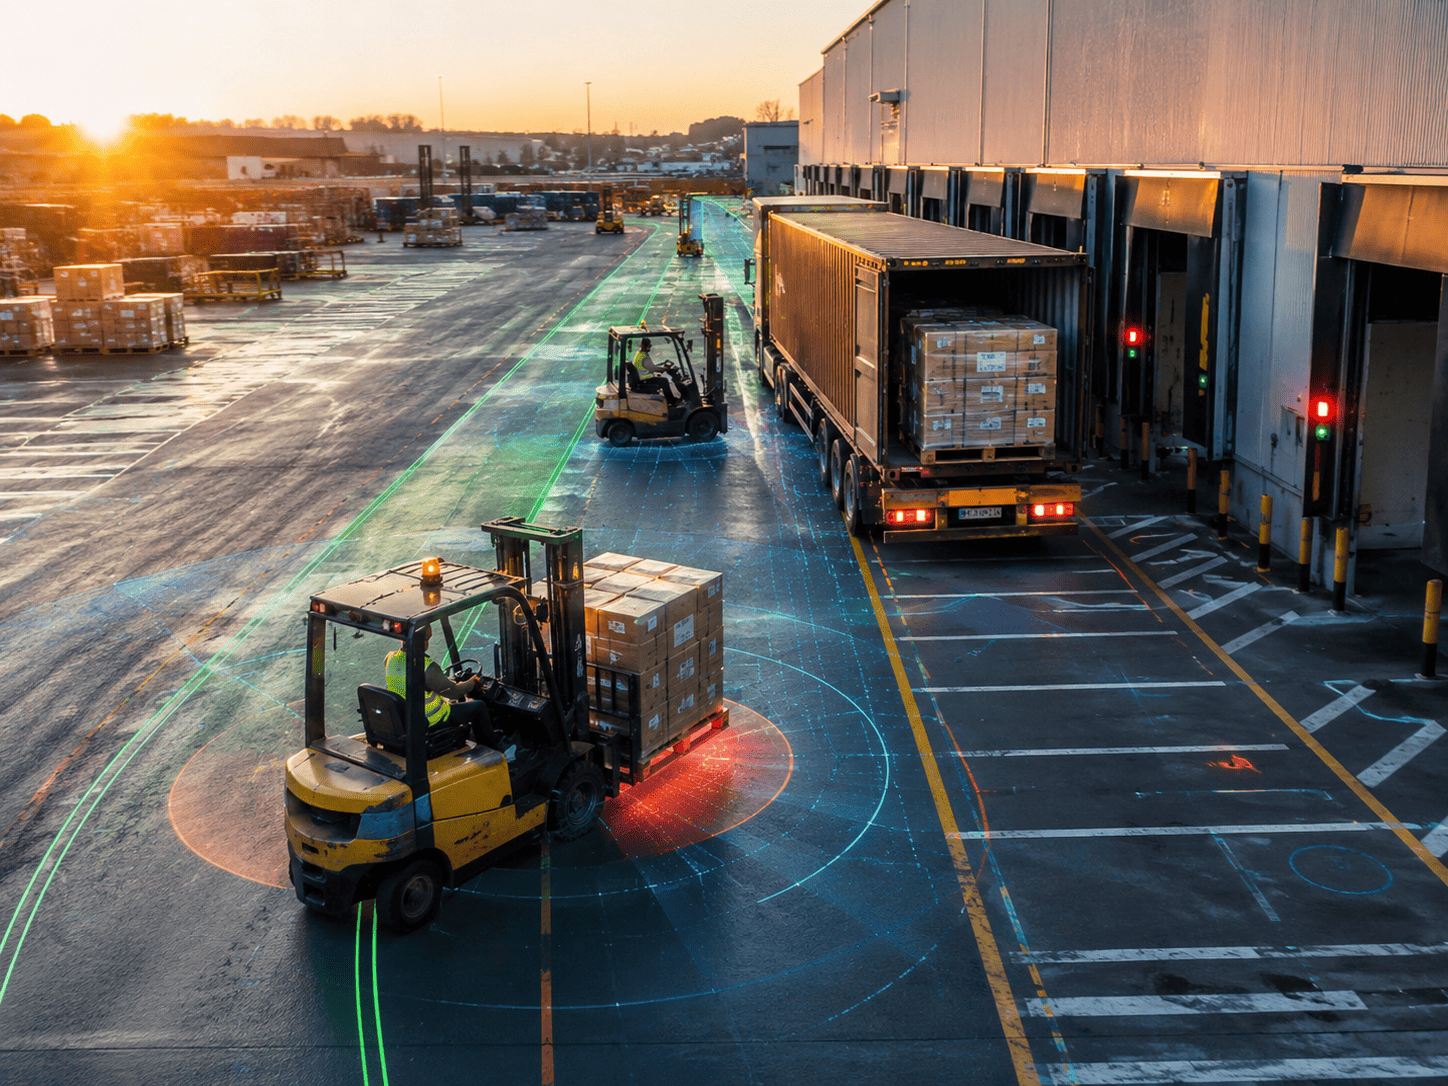
Bulldozer, loader, crane and excavator work analysis, machinery movement, unloading and actual work time.
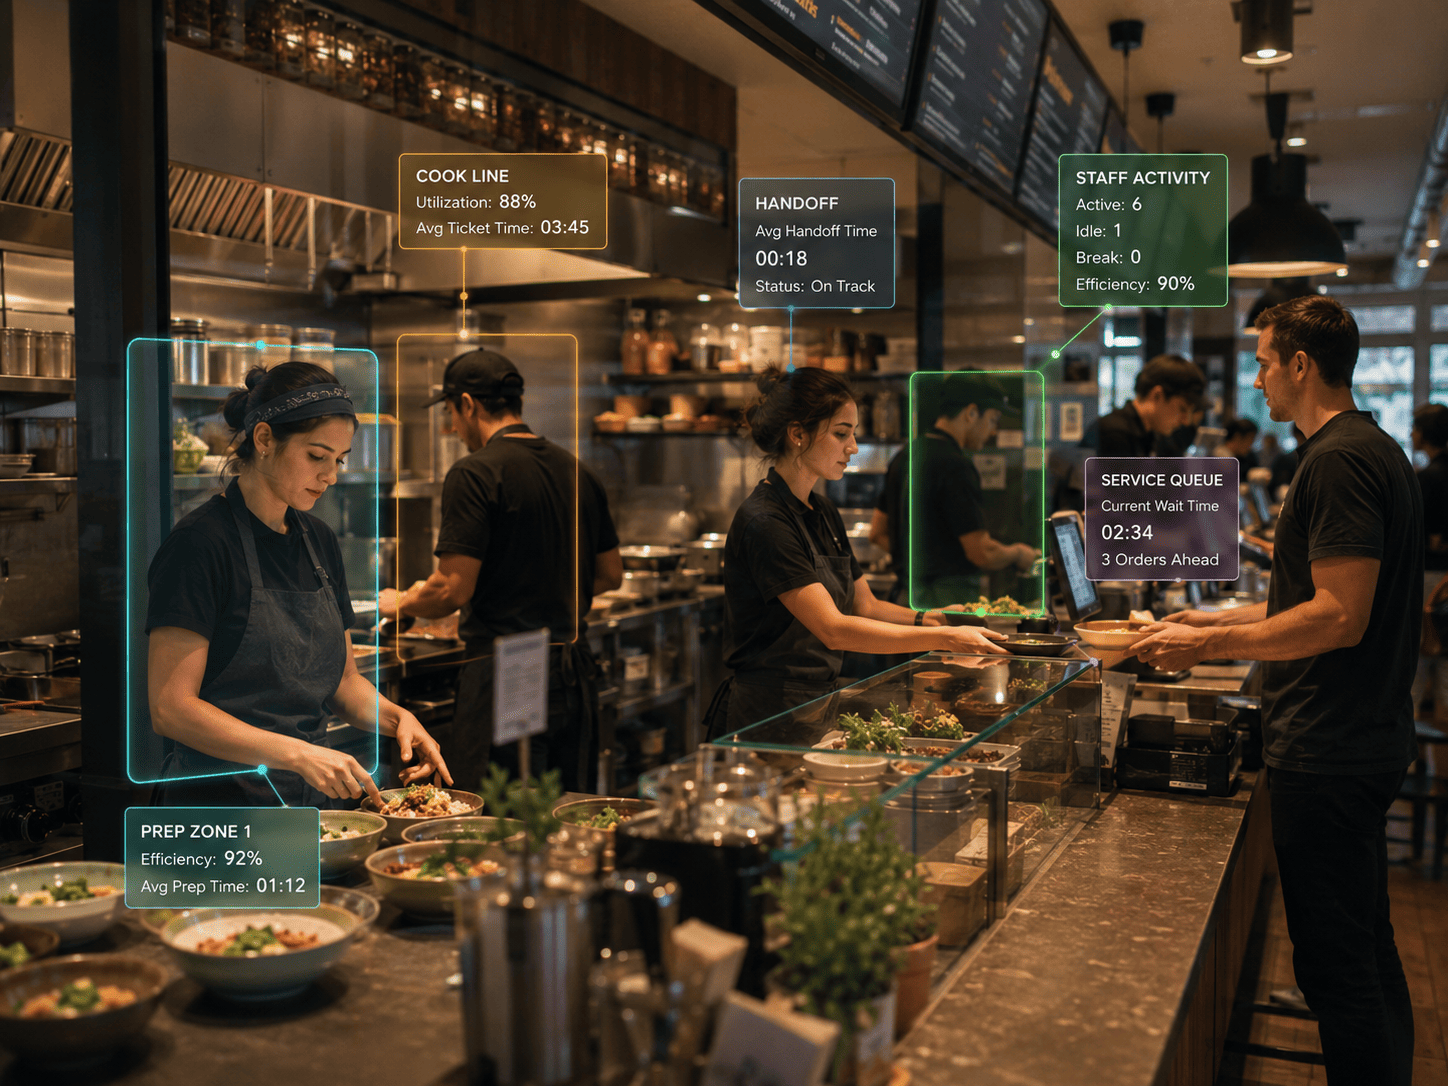
Kitchen workload, handoff speed, waiting, queues, idle staff, standard violations and service quality.
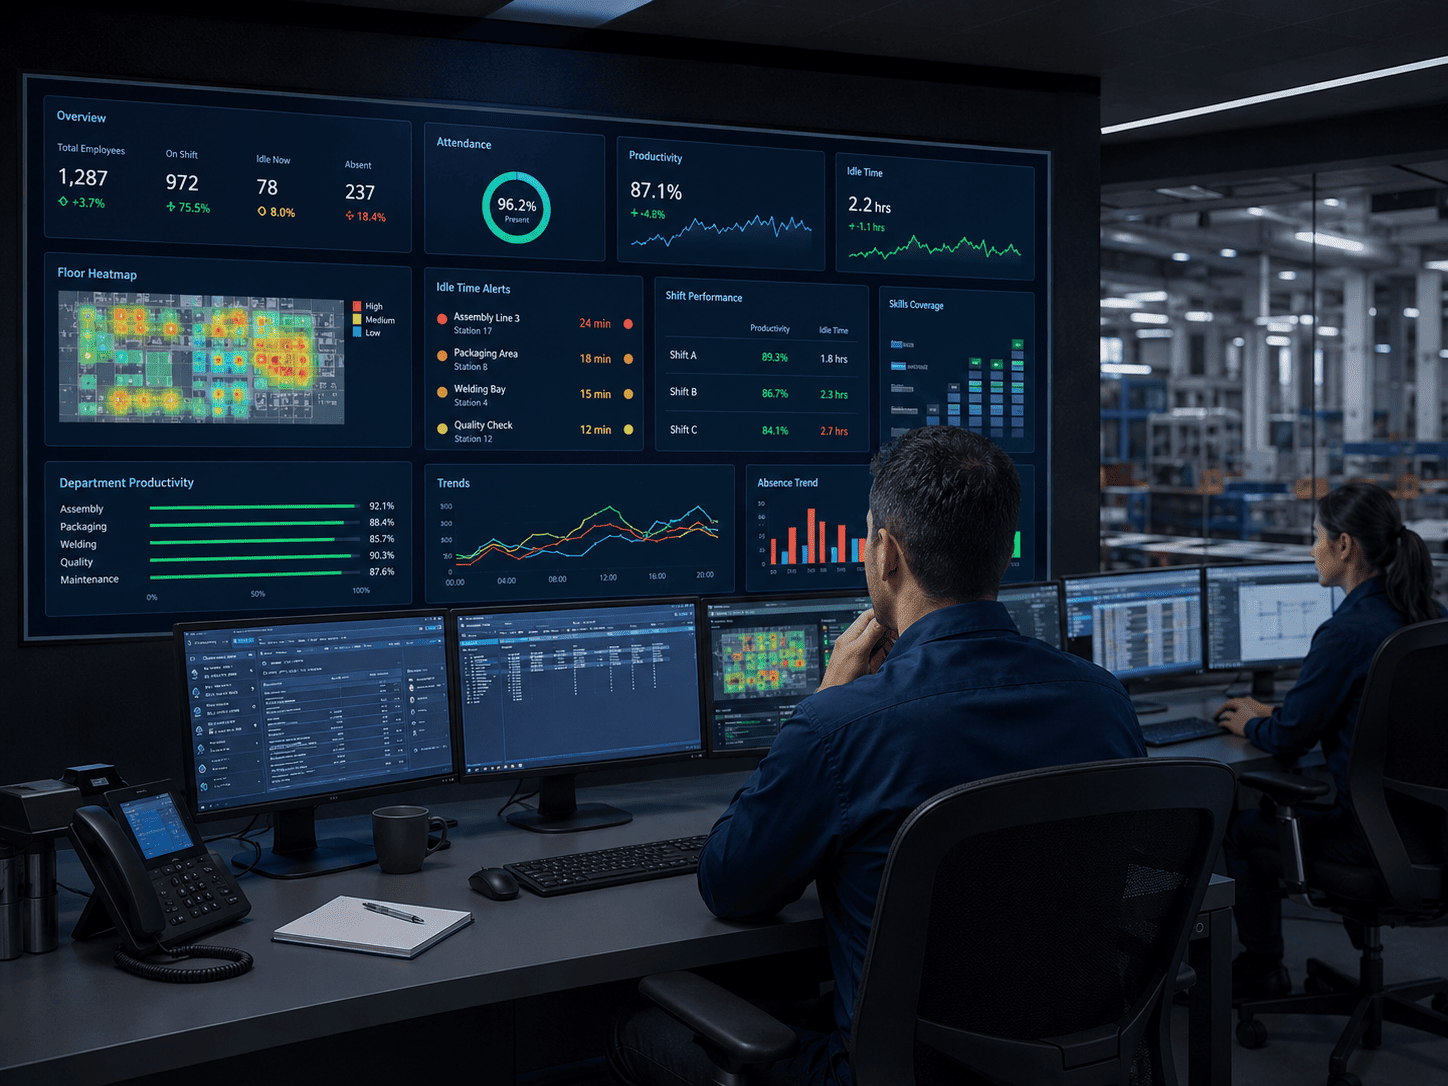
Dashboards by shifts, zones, roles, employees, deviation causes and objective efficiency evaluation.
The same platform works in a shop floor, warehouse, construction site, restaurant, office, dispatch center and transport infrastructure.
Operation timing, station workload, idle time, action control, downtime, rework and process sequence compliance.
Picking, placement, loading and unloading, forklift work, staff and equipment movement, downtime and route control.
Control of teams, equipment, rigging, under-load zones, dangerous areas, contractor presence and work stages.
Kitchen workload, handoff speed, waiting, queues, idle staff, standard violations and service quality.
Presence, work zone activity, meeting rooms, team workload, discipline and office productivity.
Operators, shifts, dispatchers, inspection rounds, incident handling, workload and staff discipline.
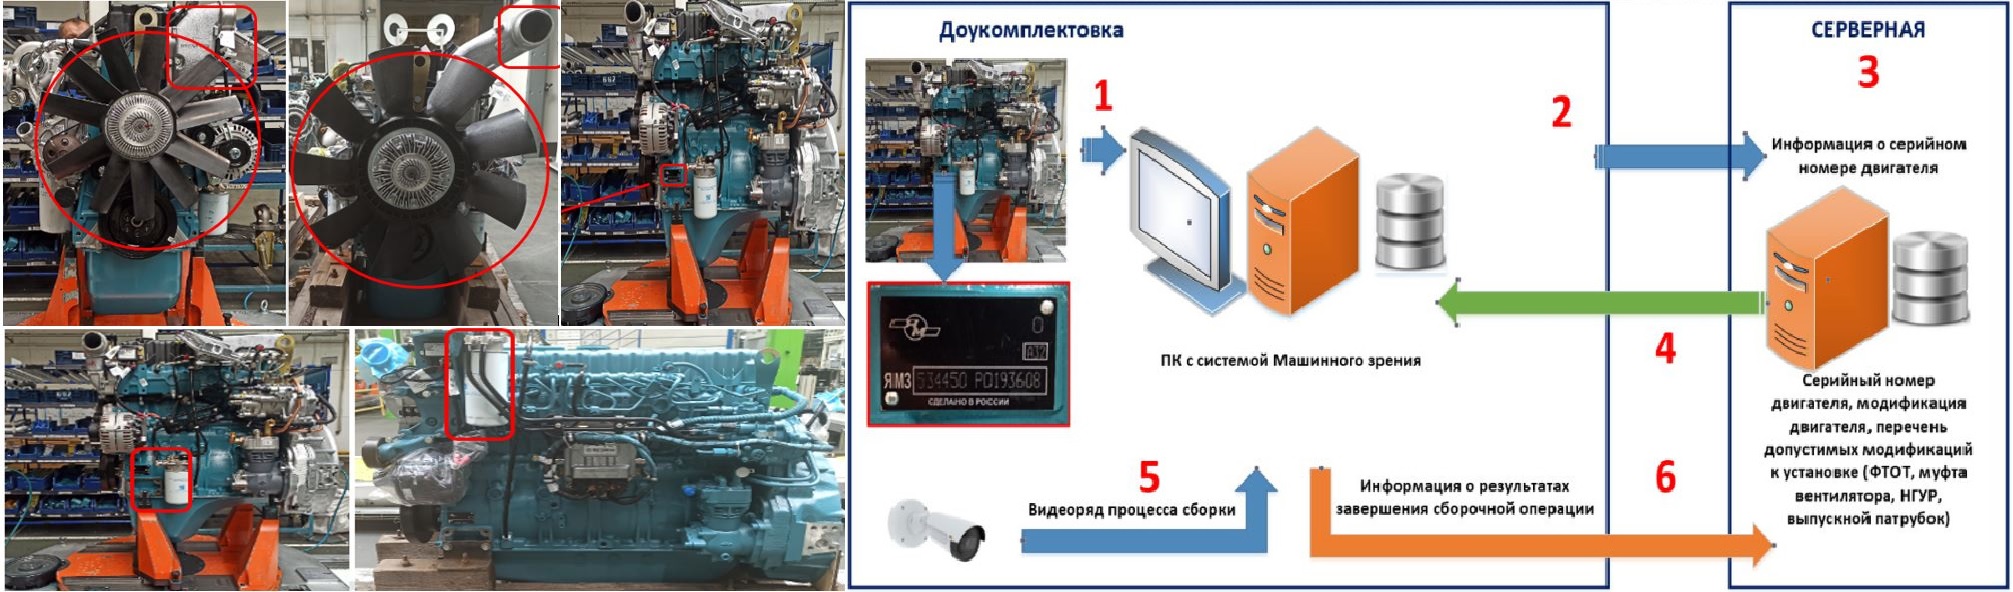
Control of assembly, action sequence, operation correctness, missed steps, work pace and visual deviations in the process.
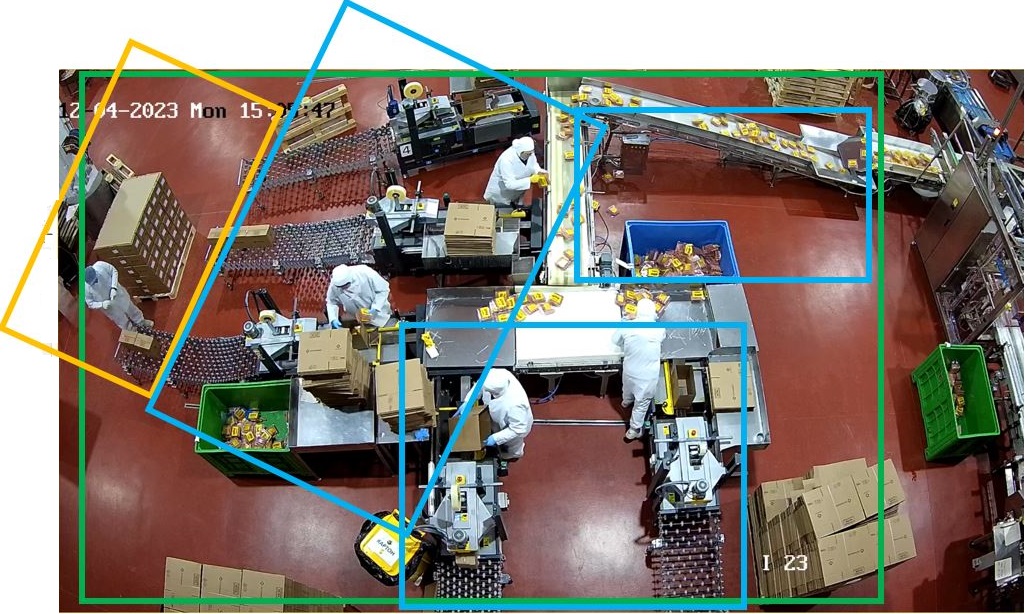
Monitoring of time in zones, boundary violations, employee routes and cross-camera tracking for behavior and utilization analysis.
Zone analytics, tracking, time studies, action control, process monitoring and equipment performance analysis in real production scenarios.
Monitoring of time spent in work, service and restricted zones with deviations and actual utilization.
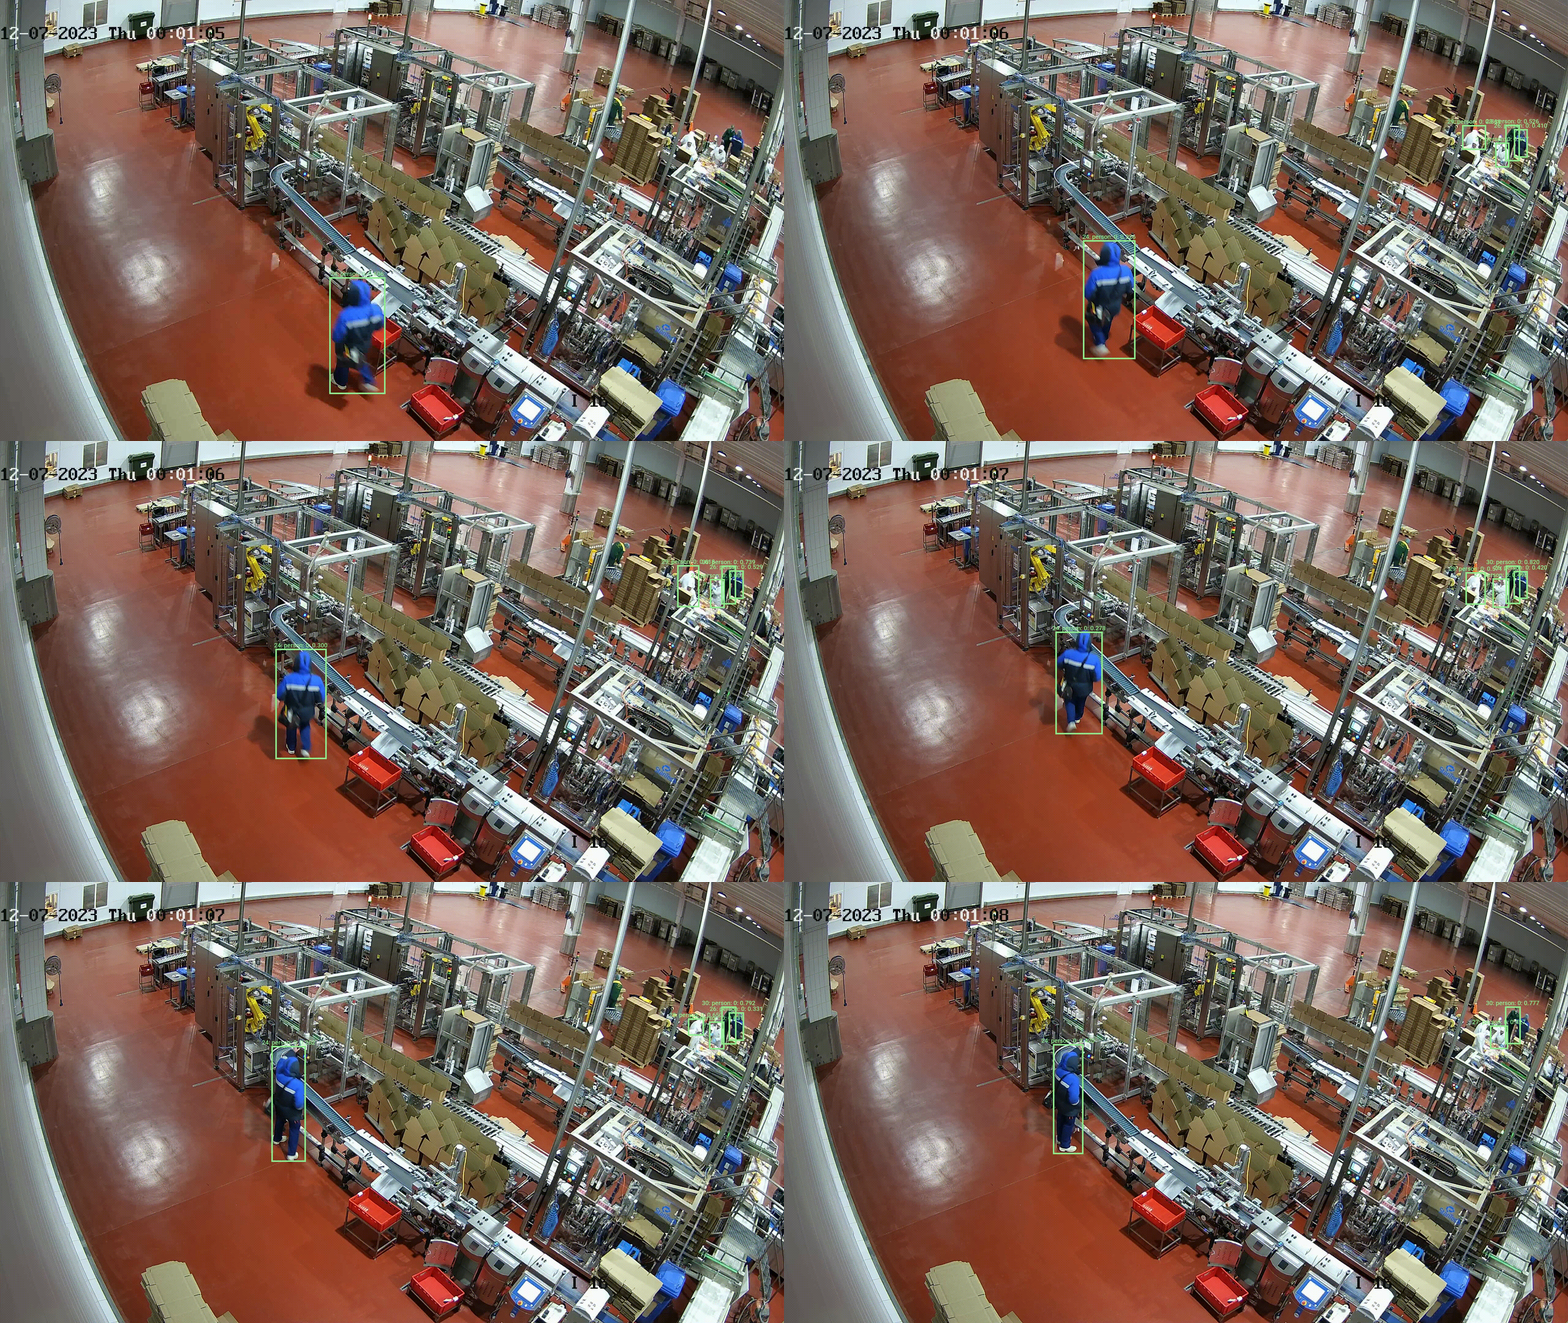
Tracking employees across cameras, restoring routes and analyzing activity.
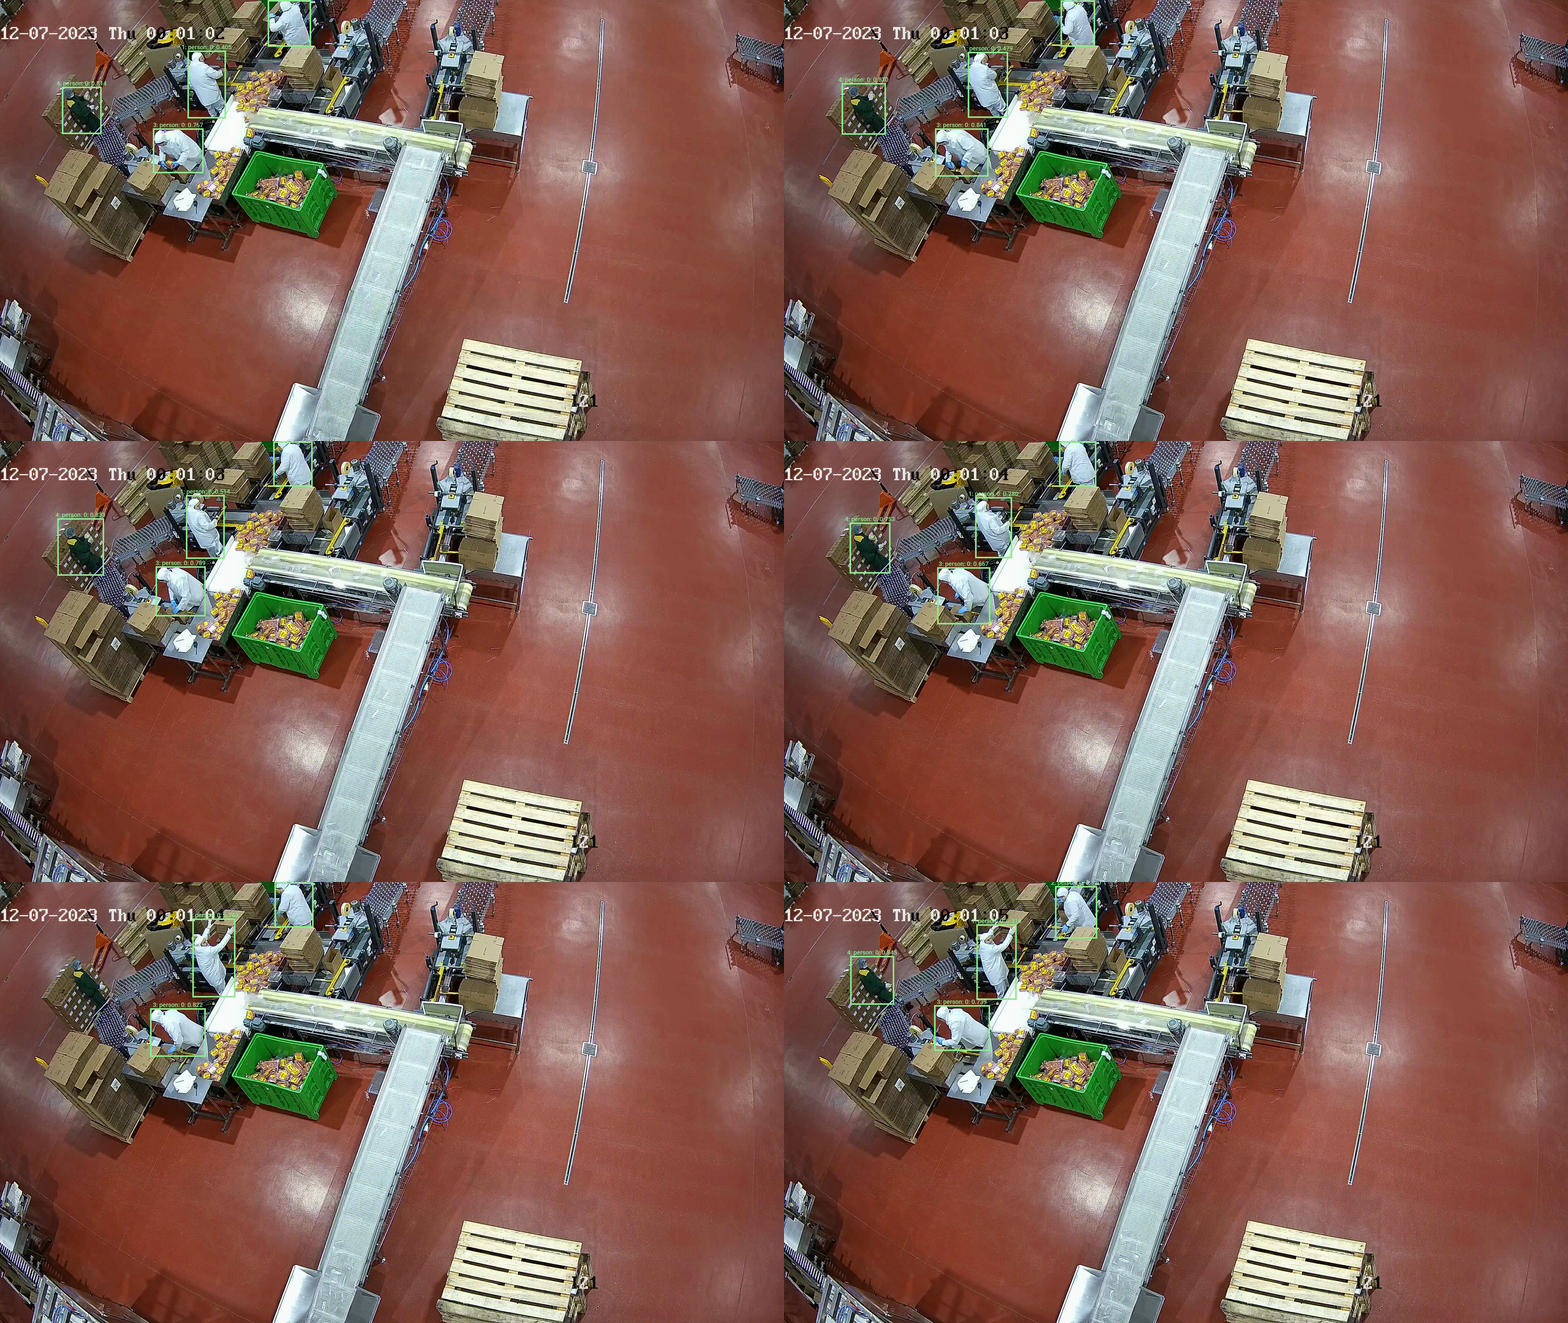
Operation timing, shift comparison, time loss detection and bottleneck analysis.
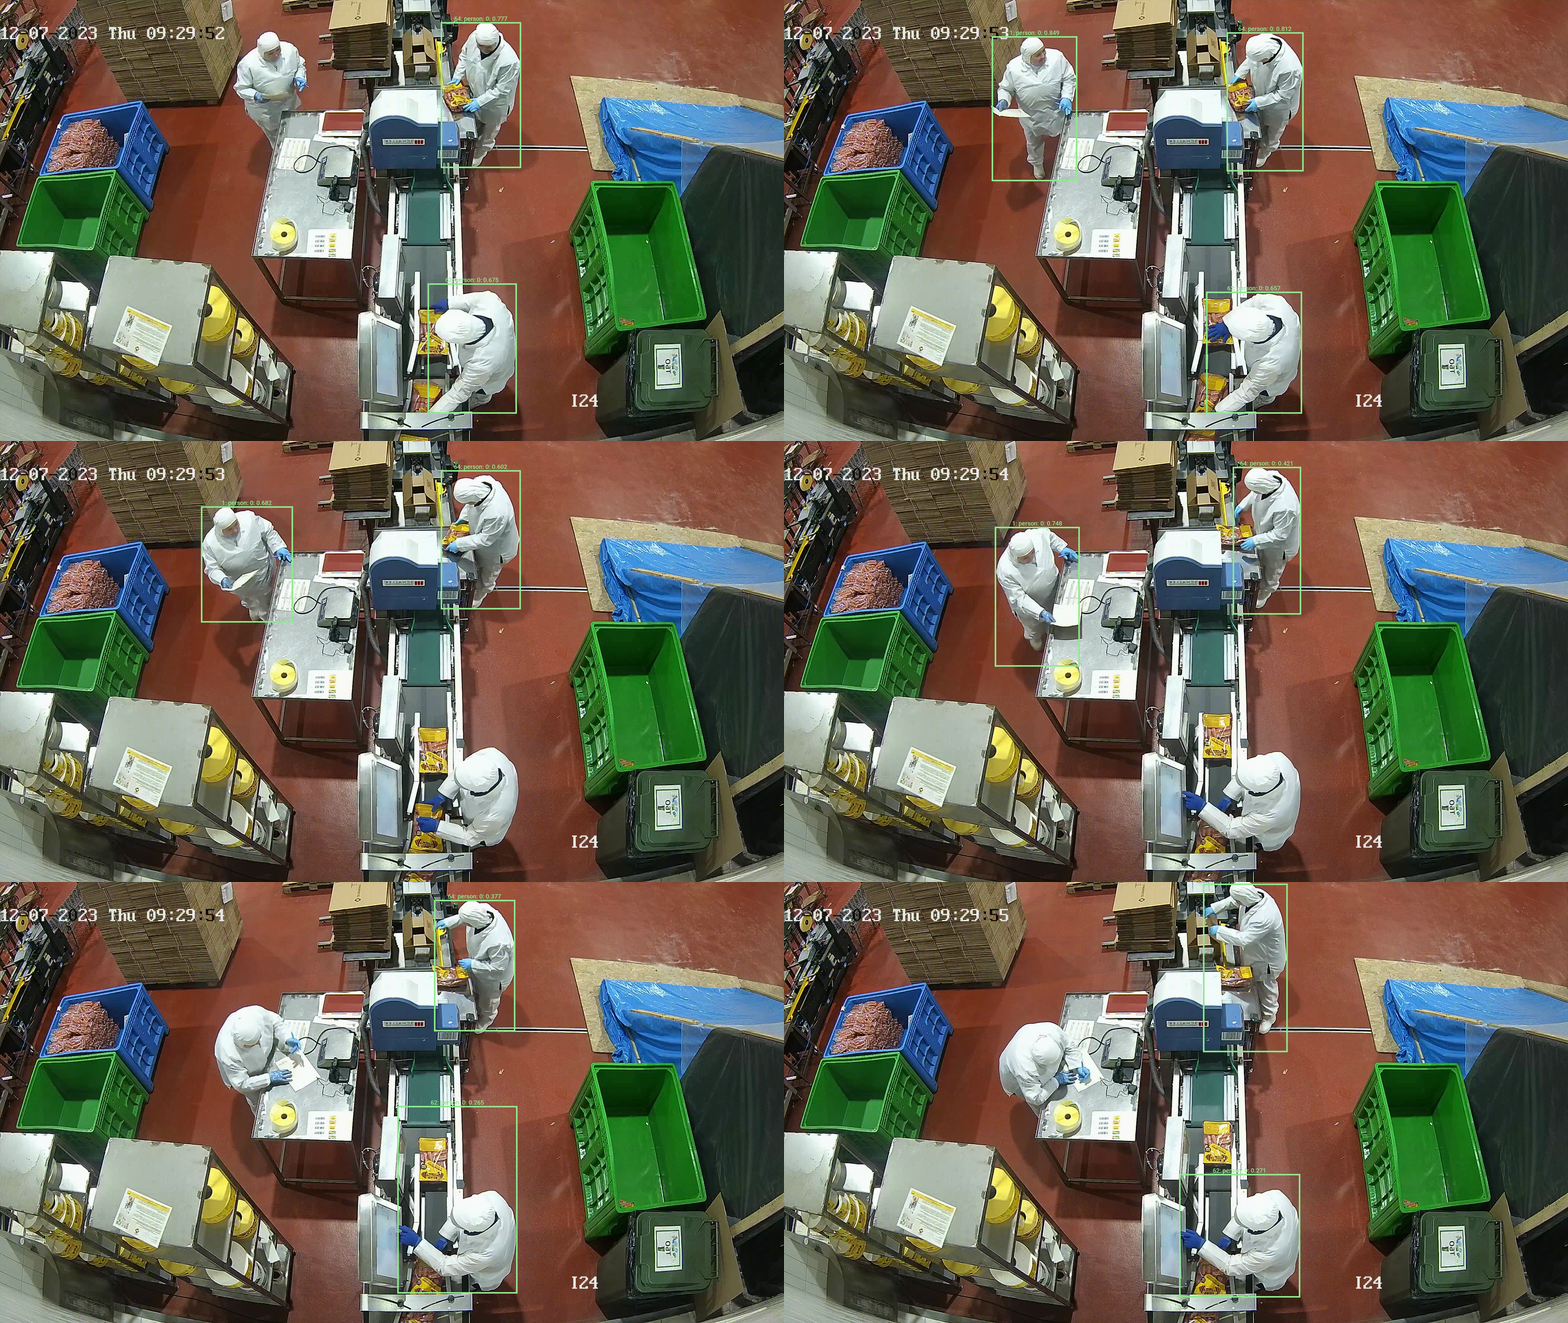
Verification of operations, stages and regulations at workstations.
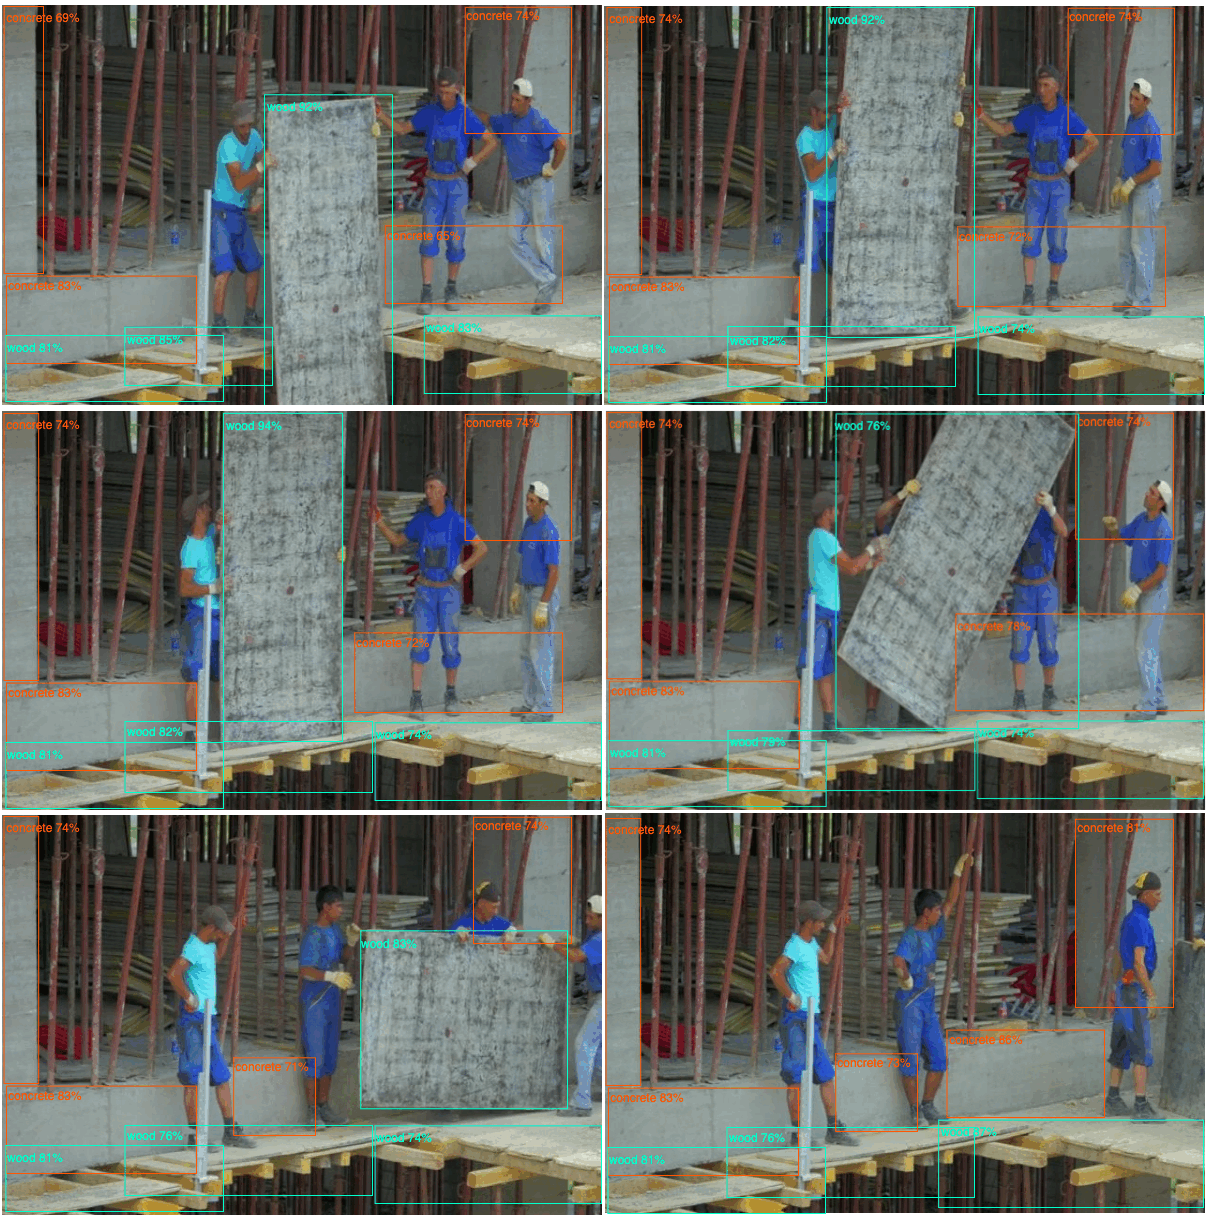
Assessment of employee actions, compliance and operation sequence.
Production process monitoring with early detection of deviations.
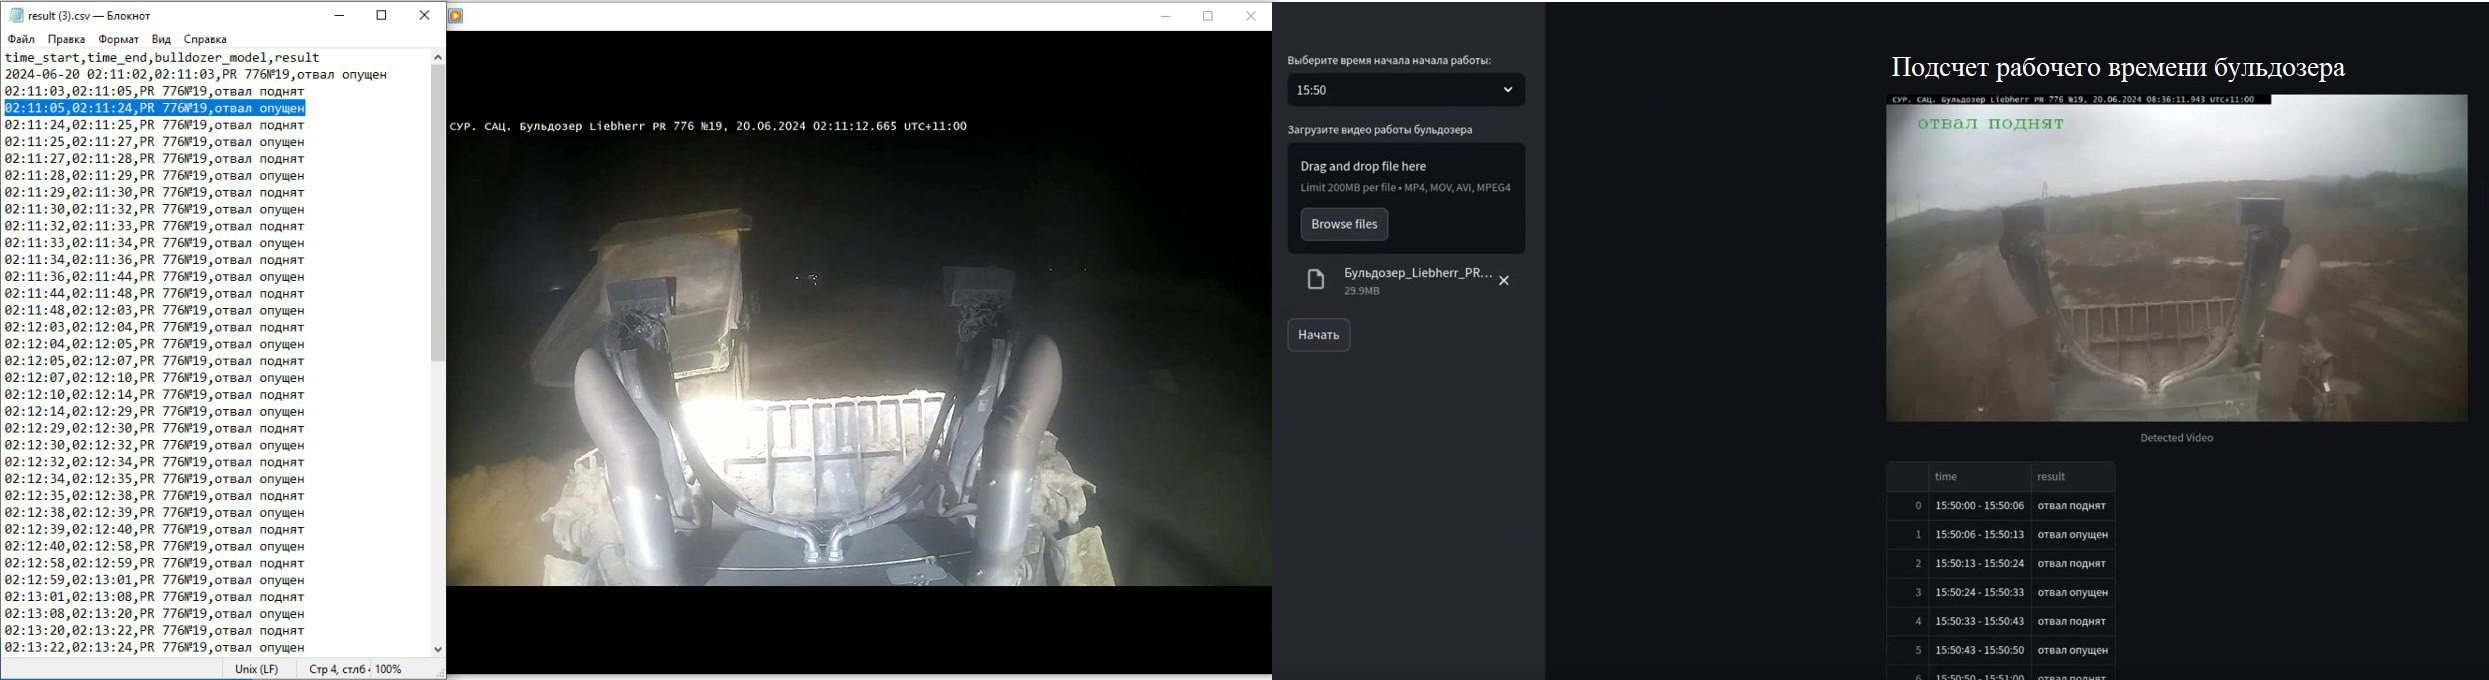
Collection of metrics on equipment modes, idle time and actual workload.
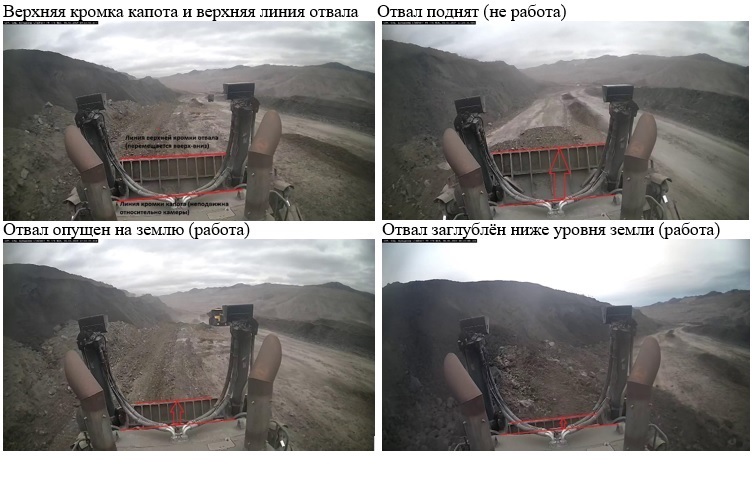
Detailed analysis of cycles, modes and efficiency of bulldozers and other machinery.
The system does not just detect a violation. It builds a chain of events: who, where, how long, which operation, why downtime occurred and how it affects KPI.
Workplaces, stations, inspection routes, waiting, loading, assembly and quality control zones are configured.
The platform measures presence, activity, idle time, waiting, zone exit and operation duration.
Events are linked to context: missing material, equipment wait, phone, conversation, crowding or route violation.
Results go to dashboards, reports, notifications, motivation, training and standard time adjustment.
Large sites need a view beyond one camera. ReID and multi-camera tracking reconstruct staff routes even after temporary visibility loss, calculate time in zones and reveal inefficient movement.
In practice, labor analytics rarely stands alone: a phone in hand, missing PPE, danger zone entry, equipment downtime or operation breach directly affects productivity, risk and quality.
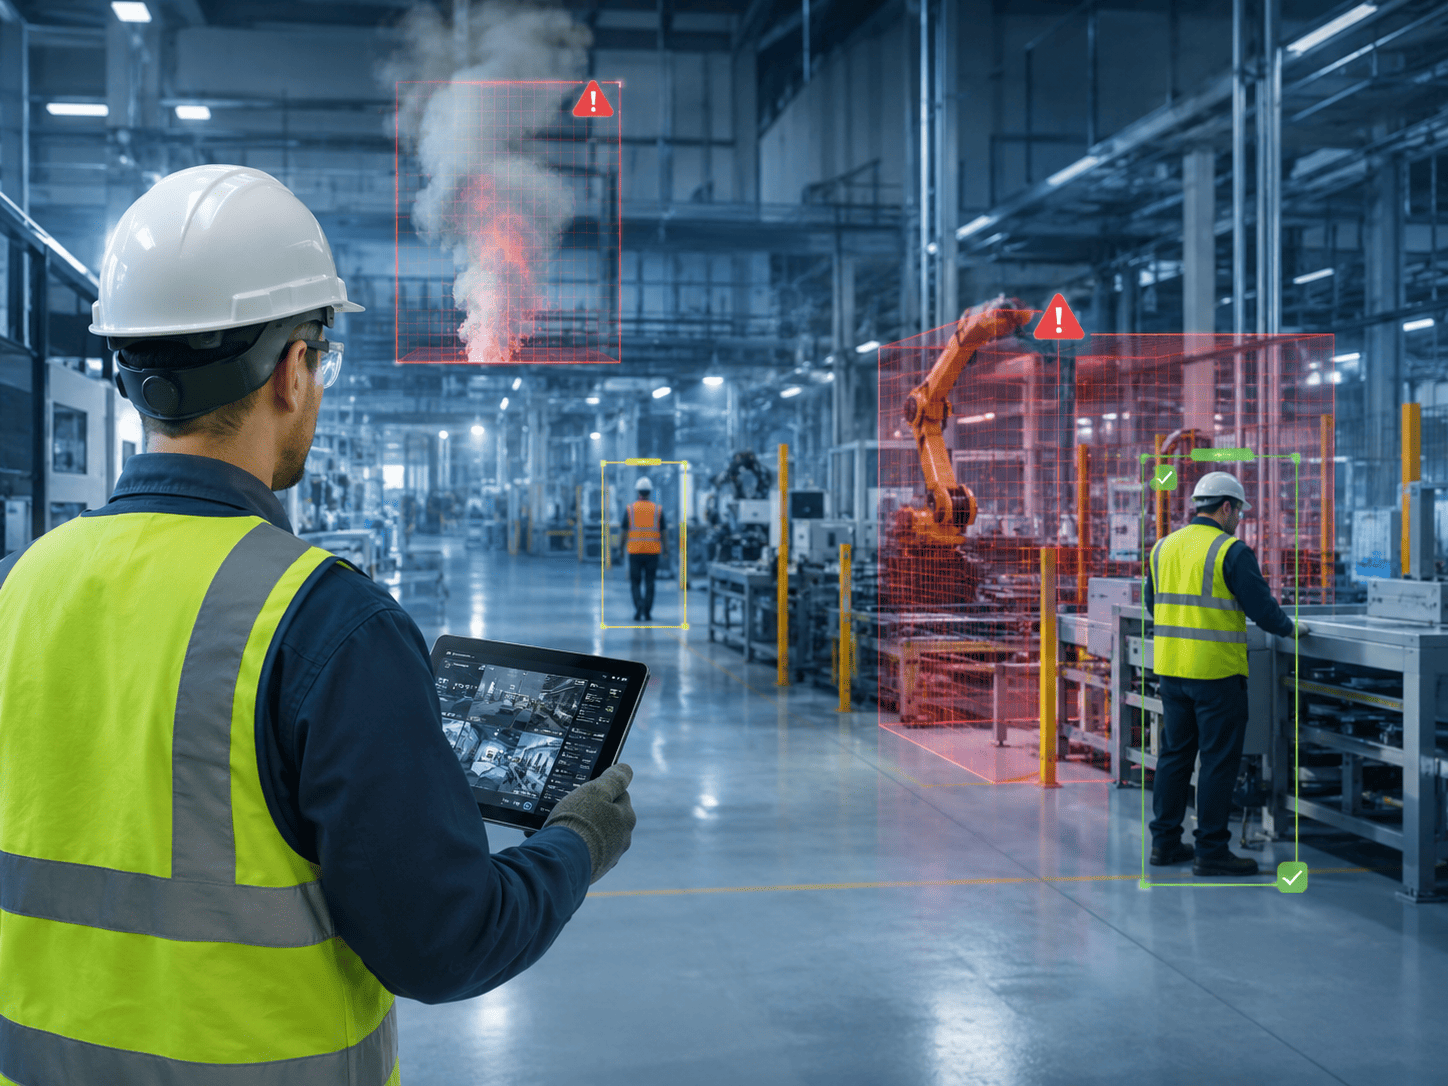
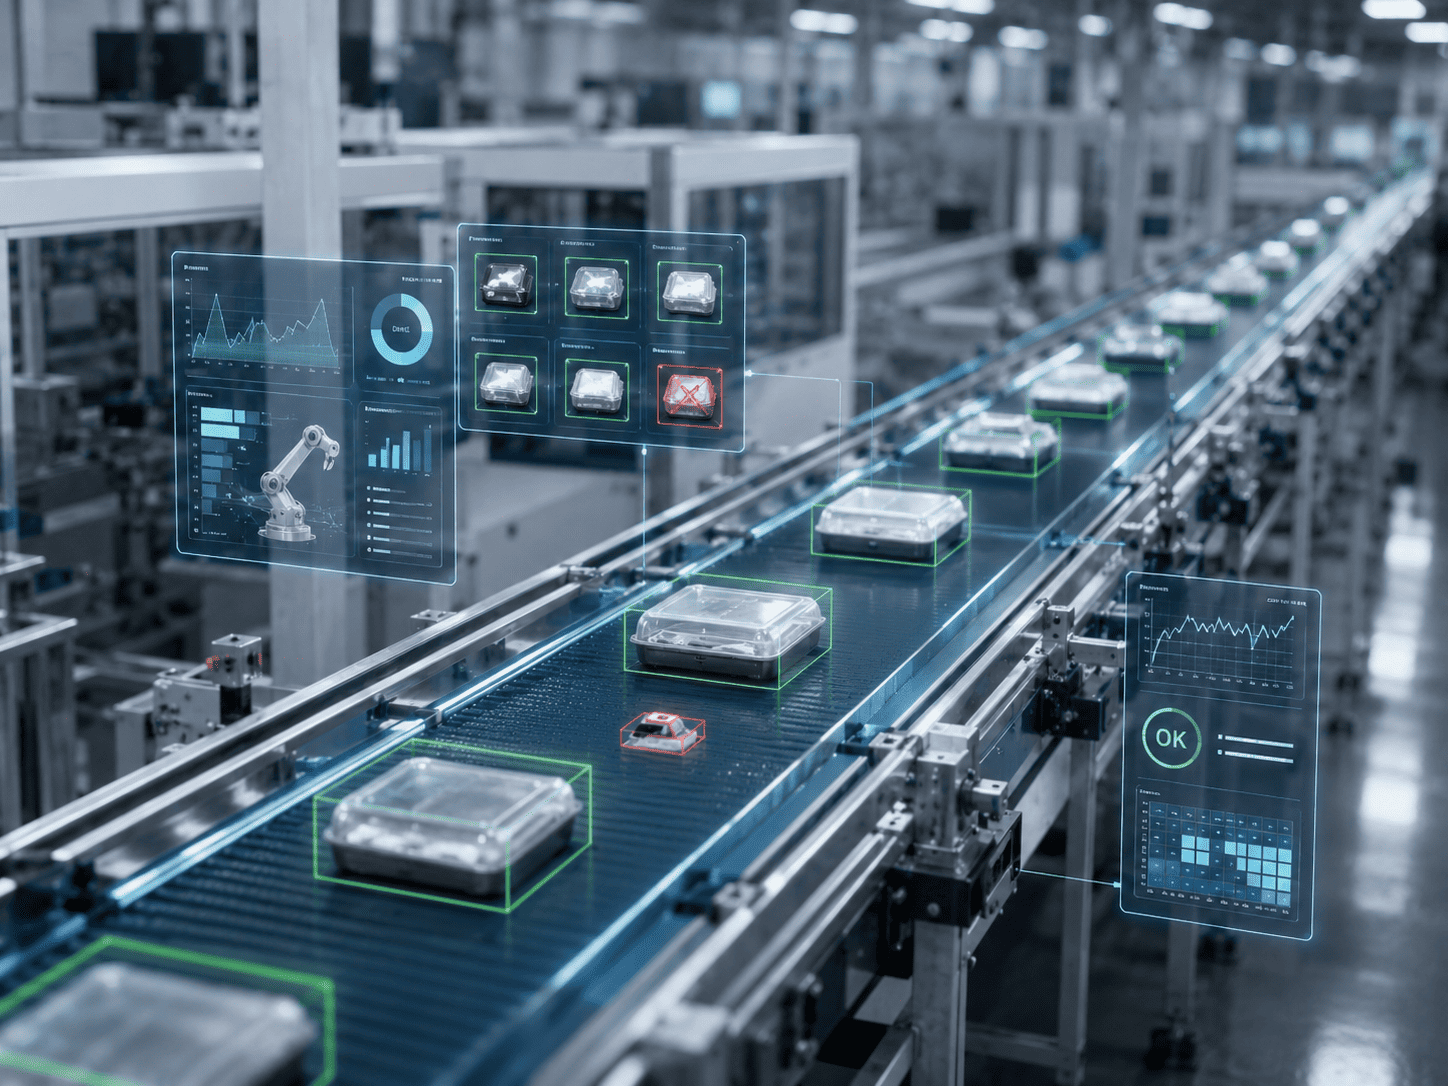
In the style of the industrial safety platform: the operator sees live events, the manager sees KPI, and the analyst sees dynamics and causes of deviations.
Shift, area, employee, downtime, attendance and workload KPI.
Activity, routes, downtime, bottlenecks and work density across the site.
Every deviation is linked to a frame, time, zone, employee or group.
Comparison of shifts, teams, contractors, areas and improvement dynamics.
The solution can be launched in cloud, on-premise or hybrid mode. A pilot usually starts with existing IP cameras, selected zones and control scenarios.
RTSP / ONVIF connection, work with archive and current video surveillance system.
Deployment inside customer infrastructure, on edge server or in hybrid architecture.
ERP, MES, SCADA, ACS, BI, Active Directory, Telegram, email, API and webhooks.
Adding new scenarios, zones, detectors and business rules as the project evolves.
Start with a pilot on one zone or line: configure scenarios, show events, reports and effect calculation for your production, warehouse, kitchen or service network.